
Figures & data
Figure 1. Flow of participants. CA: carcinoma, CR: complete response; DLBCL: diffuse large B-cell lymphoma; ECOG: Eastern-cooperative oncology group performance status; HCT: Hematopoietic stem cell transplant; HI: high-intermediate; IPI: international prognostic index; LDH: lactate dehydrogenase; LI: low-intermediate; NCCN-IPI: enhanced-IPI; PD: progressive disease; PR: partial response; RT: radiation therapy; R-CHOP: rituximab cyclophosphamide doxorubicin vincristine and prednisone; R-IPI: revised international prognostic index, t-AML: therapy-related acute myeloid leukemia, TB: tuberculosis.
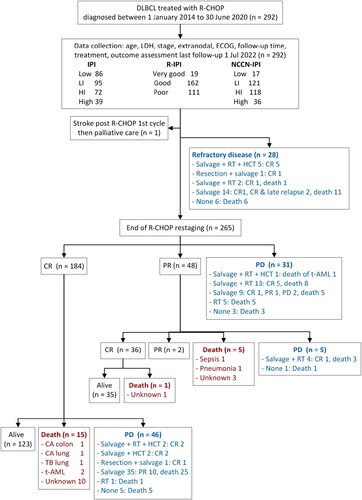
Table 1. Participant characteristics with progression and without progression.
Figure 2. The 5-year survival probability. (A) Progression-free survival and (B) overall survival.
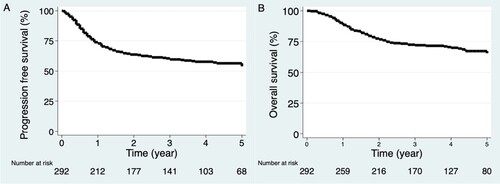
Figure 3. The 5-year progression-free survivals for risk groups according to (A) IPI, (B) R-IPI, and (C) NCCN-IPI. HI high-intermediate, IPI international prognostic index, LI low-intermediate, NCCN-IPI enhanced-IPI, R-IPI revised-IPI.
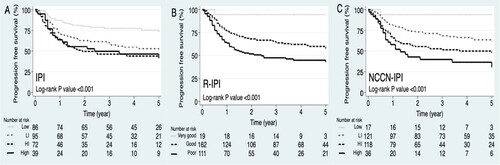
Table 2. Risk stratification, predicted outcome, and absolute difference in survival of 2-year progression-free survival by IPI, R-IPI, and NCCN-IPI.
Table 3. Discrimination at 2-year progression-free survival by IPI, R-IPI, and NCCN-IPI.
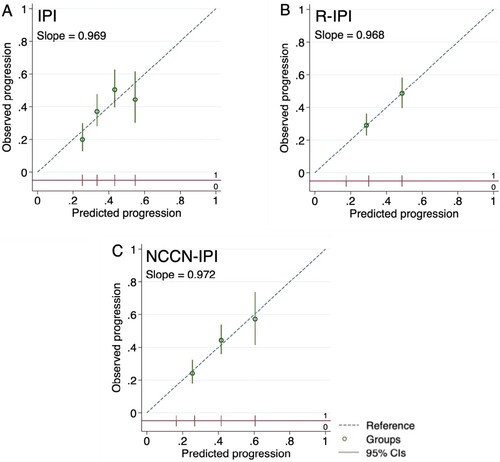
Figure 4. Calibration plots for prediction of 2-year progression of (A) IPI, (B) R-IPI, and (C) NCCN-IPI. Predicted progressions are on the x-axis, and observed progressions are on the y-axis. The circles indicate the mean predicted probability with the vertical line as the 95% confidence interval of the risk groups. The risk group distributions are vertical lines at the bottom of the graph, parallel to the x-axis. (A) Four circles represented mean low, low-intermediate, high-intermediate, and high-risk groups from left to right, respectively. (B) Two circles of R-IPI represented good and poor-risk groups. (C) Three circles of NCCN-IPI represented low-intermediate, high-intermediate, and high-risk groups. Plots (B) and (C) omitted very good R-IPI and low NCCN-IPI groups as progression occurred at less than 10%.
Data availability statement
The data that support the findings of this study are available from the corresponding author, upon reasonable request.