
Figures & data
Figure 1. Urticaria was present on the patient on presentation, characterized by diffuse, erythematous, and blanchable wheals involving the superficial dermis. (Top left, clockwise) Urticarial wheals were present on the patient’s arms, back, abdomen, and shoulders.
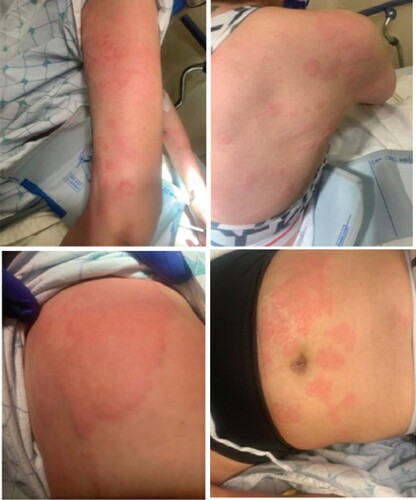
Figure 2. (Top) Serial patient venous blood gas measurements of oxygen content and methemoglobin levels were made upon hospital admission and at the two-week outpatient visit. Patient data show rapidly decreasing methemoglobin levels associated with increasing oxygen content in the days following termination of dapsone therapy. Values above the red dotted line refer to normal oxygen content. Values below the blue dotted line refer to normal methemoglobin levels. (Bottom) Patient data showing serial hemoglobin measurements during the course of dapsone therapy as indicated by values in the shaded area. Initiation of dapsone therapy is indicated by an arrow and vertical dotted line. Discontinuation of dapsone occurred during admission and is indicated by an arrow and vertical dotted line on day 0. Serial hemoglobin measurements following discontinuation of dapsone therapy are indicated by values to the right of the vertical dotted line. Values above the horizontal black dotted line refer to normal hemoglobin levels.
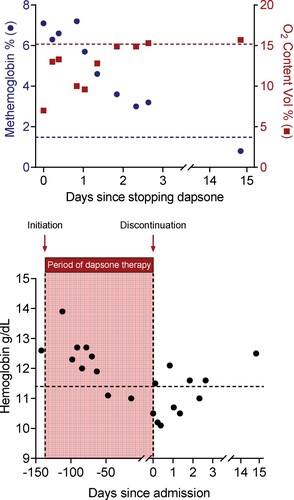
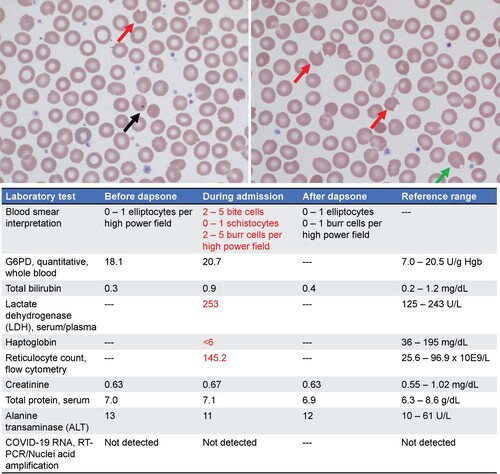
Figure 3. (Top) Patient’s peripheral blood smear at hospital admission. Red arrows indicate bite cells. Black arrow indicates a Howell-jolly body. Green arrow indicates a blister cell. (Bottom) Pertinent patient laboratory values before initiating, during treatment and after termination of dapsone therapy. Reference ranges are included to indicate normal values. Red text highlights abnormal lab values.
Supplemental Material
Download MS Word (19.3 KB)Data availability statement
All data are presented within this manuscript.