
Figures & data
Table 1. Clinical features of MDS patients.
Figure 1. Expression of miR-181a-2-3p in each group. (A) Relative expression of miR-181a-2-3p in MDS patients (n = 70) and normal controls (n = 32). (B) Relative expression of miR-181a-2-3p in the newly diagnosed MDS group (n = 54), sAML group (n = 16), and normal controls group (n = 32). (C) Relative expression of miR-181a-2-3p in the relatively low risk group (n = 16), the relatively high risk group (n = 38), sAML group (n = 16), and normal controls group (n = 32). (D) Relative expression of miR-181a-2-3p in each WHO subtype of MDS patients.
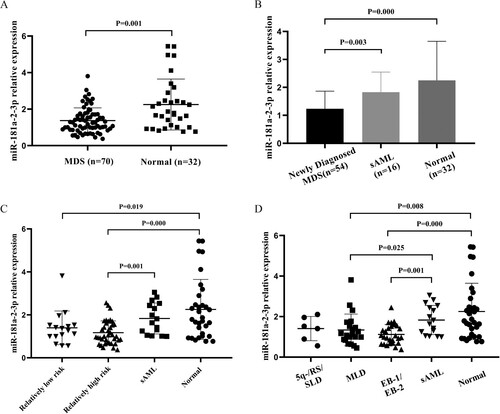
Table 2. Comparison of clinical and molecular characteristics with miR-181-2-3p expression in MDS patients.
Figure 2. Areas under the curve (AUC) of receiver operating characteristic (ROC) curves using miR-181a-2-3p for (A) differentiating patients with MDS from normal controls, and (B) distinguishing sAML from newly diagnosed MDS patients.
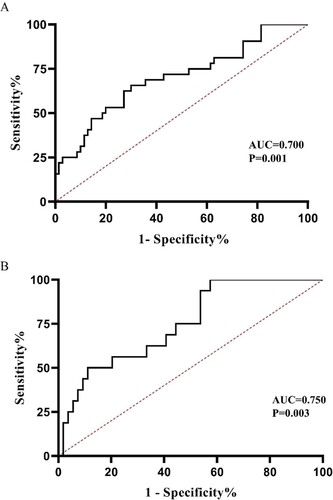
Figure 3. Kaplan–Meier survival curves of newly diagnosed MDS patients (n = 54) with different levels of miR-181a-2-3p expression.
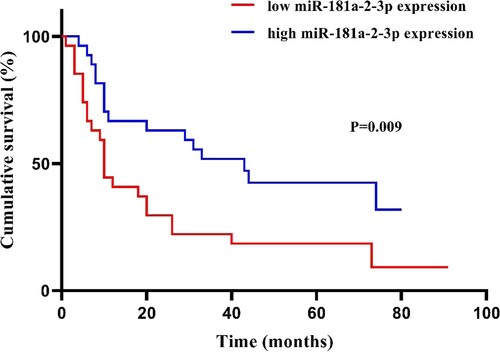
Table 3. Uni/multivariate analysis of overall survival for MDS patients excluded sAML.