
Figures & data
Table 1. Clinical charactar of all 63 female PB-DLBCL.
Figure 1. Kaplan-Meier curve of PB-DLBCL patients, a. OS, b. PFS.
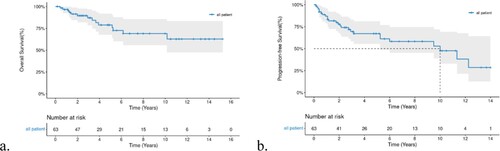
Figure 2. Kaplan-Meier curve of OS and PFS on Stage and COO a-b. Stage of OS and PFS, c. COO of OS.
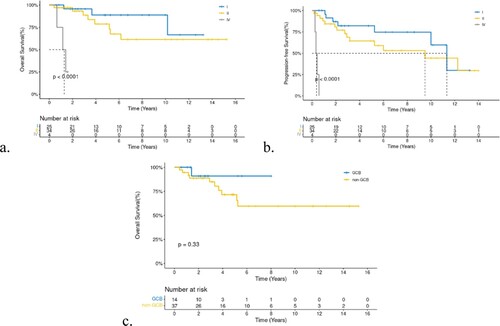
Figure 3. a-d,Kaplan-Meier curve of B symptom, ESR, LDH, and IPI in PFS, e. IPI and stage adjusted-IPI of OS.
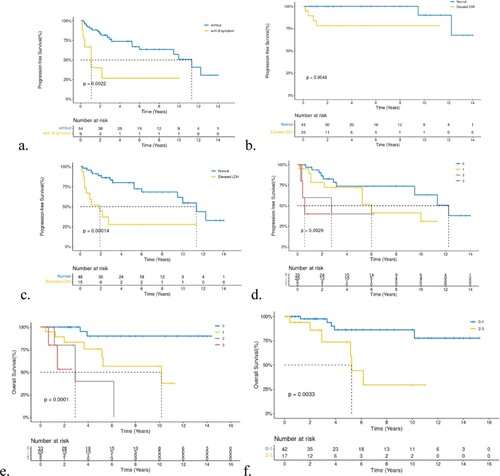
Figure 4. Kaplan-Meier curve of OS and PFS depend on Rituximab use.
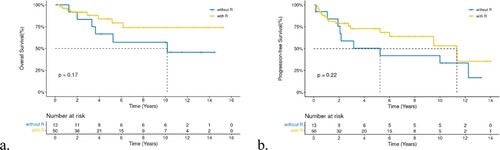
Figure 5. Kaplan-Meier curve of OS on CNS relapse and ASCT a. CNS relapse, b. CNS relapse, non-CNS relapse and non relapse, c. ASCT in R/R patients.
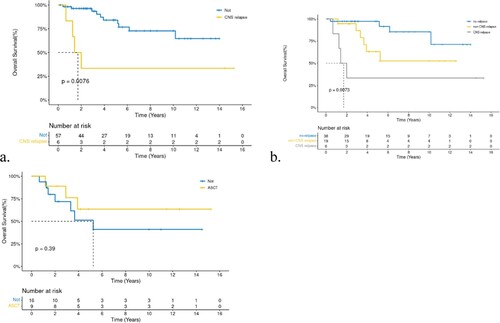
Table 2. Summarize of 25 relapse/progression patients.
Table 3. Univariate and multivariate analysis of OS and PFS.
Supplemental material