
Figures & data
Table 1. Differences between baseline characteristics in all patients according to COVID-19 progression (One-way ANOVA).
Table 2. Differences between baseline parameters according to the patients’ age.
Table 3. Differences between baseline characteristics according to the COVID-19 progression (One-way ANOVA).
Figure 1. The ROC curve analyses presenting the complete blood counts parameters significantly associated with COVID-19 progression in all patients. . Legend: ROC - receiver operating characteristic, AUC – area under the curve, LIC - large immature cells, RDW - red blood cell distribution width, PDW - platelets distribution width, WBC – leukocytes, NEU - neutrophils, PLT – platelets, PCT – plateletcrit, P/LIC – ratio of platelets and LIC.
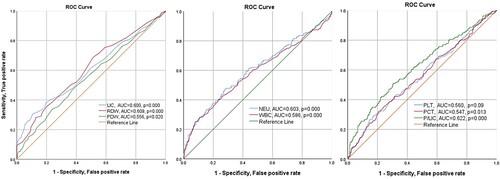
Table 4. Cut-off points from ROC curve analysis and results of the binomial logistic regressions to COVID-19 progression.
Data availability statement
The data that support the findings of this study are available on reasonable request from the corresponding author, J. M.