
Figures & data
Table 1. Participant demographic and fitness characteristics (mean ± SD).
Figure 1. a) Plot of the change in event-related spectral permutation induced by the active control condition showing the activity at pretest (i), posttest (ii), and the statistical change (in Cohen’s dᵣₘ) from pretest to posttest (iii). b) Plot of the change in event-related spectral permutation induced by the aerobic exercise condition showing the activity at pretest (i), posttest (ii), and the statistical change from pretest to posttest (iii). c) Plot illustrating the statistical differences (in Cohen’s dᵣₘ) in event-related spectral permutation at pretest (i) and posttest (ii), alongside the statistical difference (in Cohen’s dᵣₘ) in change from pretest to posttest for the aerobic exercise relative to active control condition (iii). All plots illustrate data from the frontal region of interest collapsed across congruencies of the flanker task. Time-Frequency segments of interest are indicated by the bounding box. Theta synchronisation and alpha desynchronization are depicted as power increase between 50 and 500 ms at 4–7 Hz and power decrease between 100 and 500 ms at 9–13 Hz, respectively, relative to baseline (−300 to −100 ms).
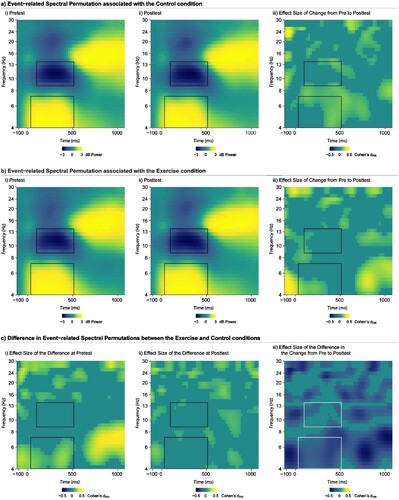
Table 2. Summary of fixed effects of the neuroelectric measures using Kenward-Roger degrees of freedom approximation (rounded to the nearest integer).
Data availability statement
The data that support the findings of this study are available from the corresponding author, [SSH], upon reasonable request.