
Figures & data
Figure 1. Flowchart of participants.
CAU = Care as usual.
Figure 2. Latent classes for the mean latent growth curves of the piecewise growth mixture modeling (PGMM).
PHQ-9 = Patient Health Questionnaire-9.
Figure 3. Kaplan-Meier estimates of the duration of depressive symptoms until first remission.
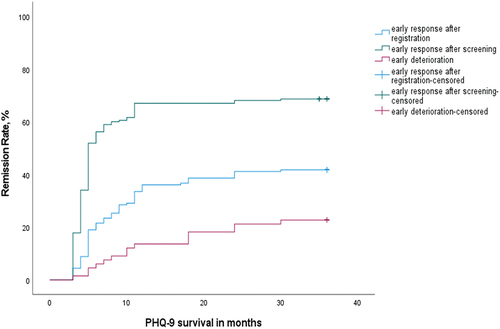
Table 1. Cumulated remission rates in the PHQ-9 over the long-term symptom course in months for the latent classes.
Table 2. Variables with a significant effect on PHQ-9 change over 36 months.