
Figures & data
Table 1. Body weight, feed intake, FER and mineral intakes of rats fed high-salt diets for 15 weeks.
Figure 1. SBP and DBP measurements during the 15-week study period. Values are presented as means ± SEM; an asterisk indicates that a point is significantly different from week 0; *P < 0.05, ***P < 0.001.
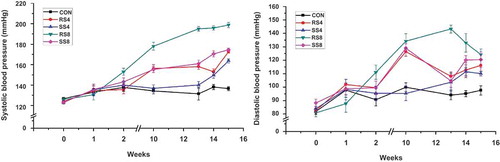
Figure 2. Overall changes in blood pressure of rats fed high salt diets from week 0 to week 15. Data are presented as mean ± SEM. Labeled means without a common letter differ significantly at P < 0.05 by Duncan’s multiple range test.
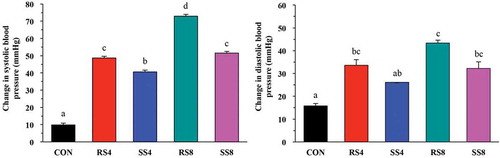
Table 2. Echocardiography of rats fed high-salt diets for 15 weeks.
Table 3. Organ weight of rats fed high-salt diets for 15 weeks.
Figure 3. Effect of high-salt diet on kidney histopathology (H & E stain, 400× magnification). (a) CON, no histopathologic lesions are seen. (b) RS4, hyaline matrix is increased in glomerular tufts. Eosinophilic homogenenous hyaline droplets (arrows) are seen in the cytoplasm of proximal convoluted epithelium. (c) RS8, numerous eosinophilic homogeneous hyaline droplets (arrows) are filled with cytoplasm of proximal convoluted epithelial cells. Pale eosinophilic hyaline matrix is increased in glomerular tufts. (d) SS4 and (e) SS8, only scant eosinophilic homogeneous hyaline droplets (arrows) are observed in the cytoplasm of proximal convoluted epithelial cells. No histopathological lesions are seen in the glomerular tufts.
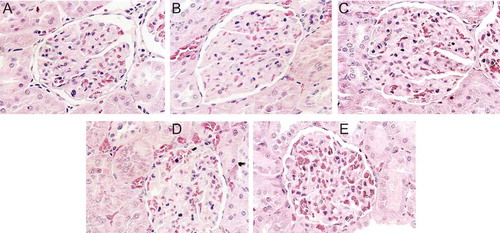
Figure 4. Effect of high-salt diet on kidney histopathology as revealed by Masson’s trichrome staining in the glomerular capsule and tufts (400× magnification). (a): CON, no fibrosis. (b): RS4, moderate fibrosis (arrows). (c): RS8, severe fibrosis (arrows). (d): SS4, and (e): SS8, very mild fibrosis (arrows). Graph on the bottom shows quantitative representation of renal injury in the kidneys of Dahl salt sensitive rats fed the different diets for 15 weeks. Glomerulosclerosis index for each rat was used to estimate the renal damage. Values are presented as mean ± SEM. Labelled means without a common letter differ significantly at P < 0.05.
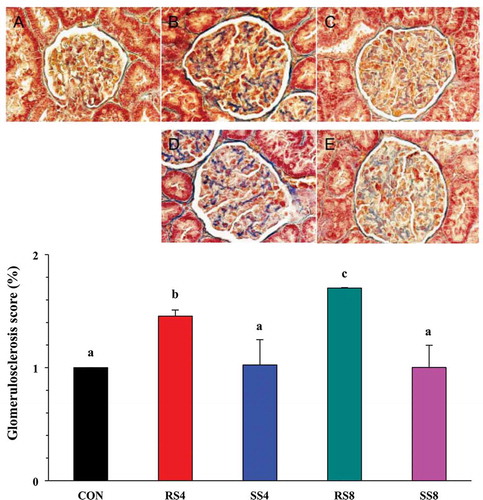
Table 4. Biochemical indices of rats fed high-salt diets for 15 weeks.