Figures & data
Figure 1. The putative structure of IMD. (a) Nonreducing end α-Glcp; (b) 1,3-linked α-Glcp; (c) 1,4-linked α-Glcp; (d) 1,6-linked α-Glcp; (e) 1,3,6-linked α-Glcp; (f) 1,4,6-linked α-Glcp; (g) reducing-end Glcp.
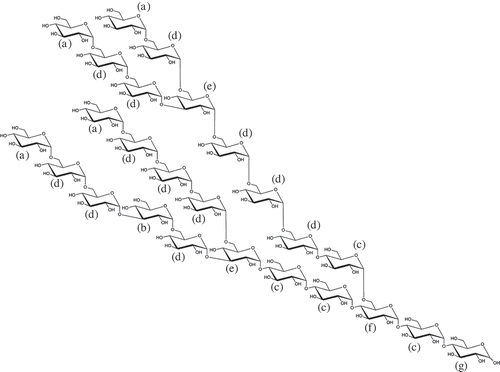
Table 1. Characteristics of subjects in each test.
Figure 2. The Δ(blood glucose) and Δ(serum insulin) during the MD loading study. Each subject ingested a solution containing 46.8 g of MD. The time course for the Δ(blood glucose) and Δ(serum insulin) was compared between the MD + IMD (9.6 g) group and the MD alone group. Significant test in the time course of Δ(blood glucose) or Δ(serum insulin) was conducted at a peak time after ingestion of MD alone. Their times were 45 min in Δ(blood glucose), 45 min in Δ(serum insulin) of all subjects, and 60 min in Δ(serum insulin) of subjects with Δ(blood glucose) ≥70 mg/dL. (a) Δ(blood glucose) in all subjects, (b) Δ(blood glucose) in the group of subjects with Δ(blood glucose) ≥70 mg/dL, (c) AUC of Δ(blood glucose) in all subjects and the group of subjects with Δ(blood glucose) ≥70 mg/dL, (d) Δ(serum insulin) in all subjects, (e) Δ(serum insulin) in subjects with Δ(blood glucose) ≥70 mg/dL, (f) AUC of Δ(serum insulin) in all subjects and the group of subjects with Δ(blood glucose) ≥70 mg/dL.○ or white bar: no IMD added, ● or black bar: IMD added. *Significant vs the group without IMD (p < 0.05).
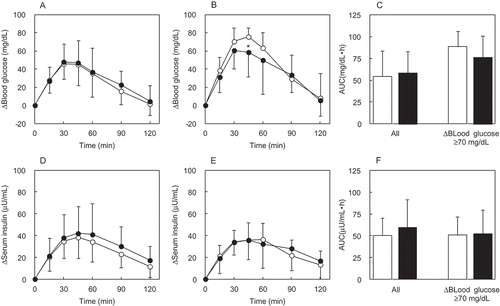
Figure 3. The Δ(blood glucose) and Δ(serum insulin) in the sucrose loading study. Each subject ingested a solution containing 100 g of sucrose. Time course for the Δ(blood glucose) and Δ(serum insulin) was compared between the sucrose + IMD (9.6 g) and sucrose alone group. Significant test in the time course of Δ(blood glucose) or Δ(serum insulin) was conducted at a peak time after ingestion of sucrose alone. Their times were 30 min in Δ(blood glucose), 45 min in Δ(serum insulin) of all subjects, and 30 min in Δ(serum insulin) of subjects with Δ(blood glucose) ≥75 mg/dL. (a) Δ(blood glucose) in all subjects, (b) Δ(blood glucose) in the group of subjects with Δ(blood glucose) ≥75 mg/dL, (c) AUC of Δ(blood glucose) in all subjects and the group of subjects with Δ(blood glucose) ≥75 mg/dL, (d) Δ(serum insulin) in all subjects, (e) Δ(serum insulin) in the groups of subjects with Δ(blood glucose) ≥75 mg/dL, (f) AUC of Δ(serum insulin) in all subjects and the group of subjects with Δ(blood glucose) ≥75 mg/dL. ○ or white bar: no IMD added, ● or black bar: IMD added. *Significant vs the group without IMD (p < 0.05).
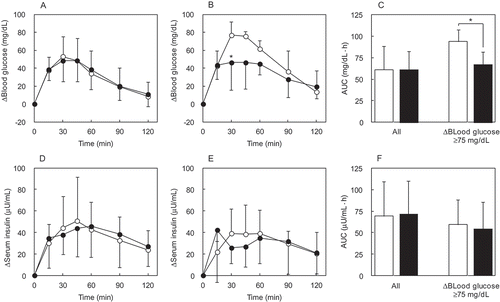
Figure 4. The Δ(blood glucose) following IMD (5 or 10 g) ingestion together with glucose loading. Each subject ingested a solution containing 50 g of glucose. The time course for Δ(blood glucose) was compared between the glucose + IMD (5 or 10 g) group and glucose alone group. Significant test in the time course of Δ(blood glucose) was conducted at a peak time, 45 min after ingestion of glucose alone. (a) Δ(blood glucose) in the glucose + IMD (5 g) group, (b) Δ(blood glucose) in the glucose + IMD (10 g group, (c) AUC of Δ(blood glucose) in the glucose + IMD (5 g and 10 g) groups. ○ or white bar: no IMD added, ● or black bar: IMD added. *Significant vs group without IMD (p < 0.05).
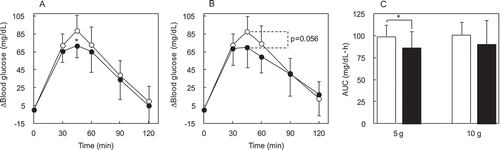
Figure 5. The effects of IMD on glucose absorption in vitro. Glucose transport of everted rat intestinal sac was evaluated. Glucose concentration (0–120 min) (a) and total glucose (120 min) (b) of serosal side were compared between groups without IMD (control group) and with IMD (test group) of KRB buffer solution around sac. ○ or white bar: no IMD added, ● or black bar: IMD added. **Significant vs control group (p < 0.01).
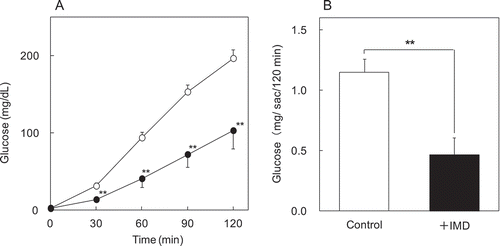
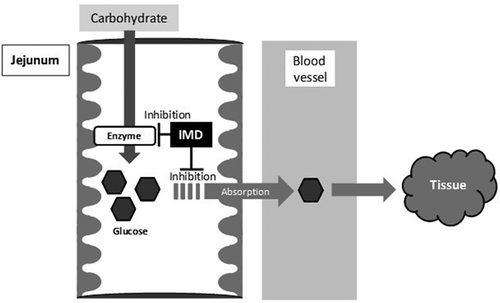
Figure 6. The mechanism of attenuation of postprandial blood glucose in humans consuming IMD. IMD might reduce the magnitude of a postprandial blood glucose excursion after carbohydrate ingestion caused by inhibition of glucose absorption and enzyme activity.