Figures & data
Scheme 1. Experimental design for evaluating the antiproliferative and proapoptotic effects of blueberry anthocyanins and anthocyanidins on B16-F10 cells.
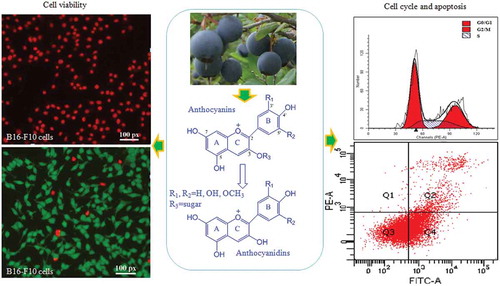
Figure 1. High-performance liquid chromatography chromatograms of anthocyanins and anthocyanidins from blueberry fruits and purified extracts detected at 520 nm. 1, Delphinidin-3-O-galactoside; 2, delphinidin-3-O-glucoside; 3, cyanidin-3-O-galactoside; 4, delphinidin-3-O-arabinoside; 5, cyanidin-3-O-glucoside; 6, petunidin-3-O-galactoside; 7, cyanidin-3-O-arabinoside; 8, petunidin-3-O-glucoside; 9, peonidin-3-O-galactoside; 10, petunidin-3-O-arabinoside; 11, peonidin-3-O-glucoside; 12, malvidin-3-O-galactoside; 13, malvidin-3-O-glucoside; 14, malvidin-3-O-arabinoside; 15, petunidin-3-O-xyloside; 16, malvidin-3-O-xyloside; a, delphinidin; b, cyanidin; c, petunidin; d, peonidin; e, malvidin.
Figure 2. Effects of different concentrations of anthocyanidins, anthocyanins, and doxorubicin on the cell viability of B16-F10 and L929 cells at 24 h, 48 h, and 72 h based on the MTT assay (A–F), and the corresponding median inhibitory concentration (IC50) values (G, H). Data are presented as mean ± SD (n = 6). *p < 0.05 compared with the anthocyanidin-treated group.
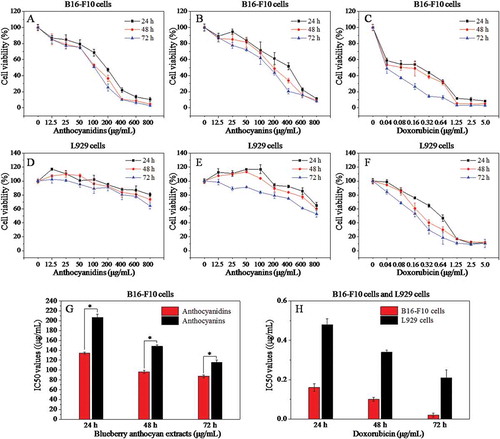
Figure 3. Morphology of B16–F10 cells by calcein acetoxymethyl ester/propidium iodide fluorescein staining. Cells were treated with anthocyanidins (A1–A6) and anthocyanins (B1–B6) at various concentrations (25–800 μg/mL) for 48 h. Non-treated B16-F10 cells served as the negative control (C1), while doxorubicin was the positive control (D1–D3). The fluorescence images were obtained by inverted fluorescence microscopy.
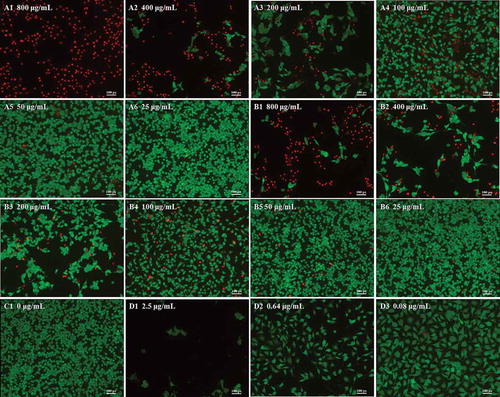
Figure 4. Flow cytometric analysis of the cell cycle in B16–F10 cells treated with blueberry anthocyanidins (A1–A6, E1) and anthocyanins (B1–B6, E2) at various concentrations (50–800 μg/mL) after 48 h. Non-treated B16–F10 cells served as the negative control (C1), while doxorubicin was the positive control (D1–D3, E3).
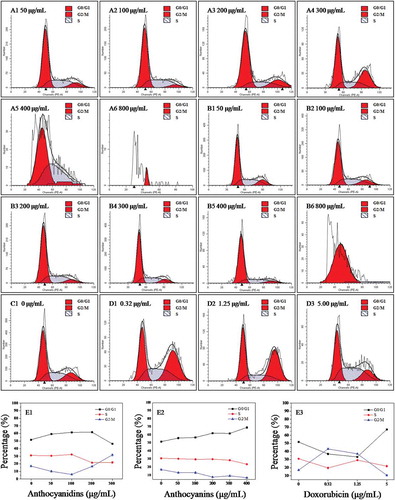
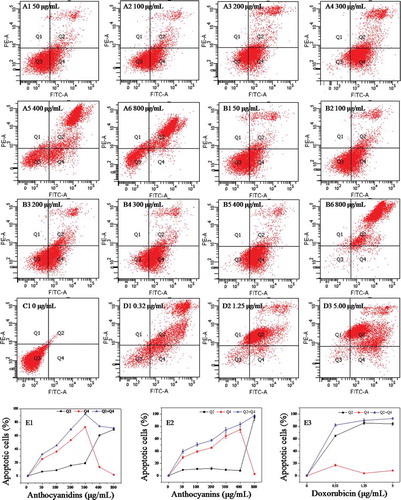
Figure 5. Annexin V–fluorescein isothiocyanate/propidium iodide flow cytometric analysis of cell apoptosis in B16–F10 cells in the presence of blueberry anthocyanidins (A1–A6, E1) and anthocyanins (B1–B6, E2) at various concentrations (50–800 μg/mL) after 48 h. Non-treated B16–F10 cells served as the negative control (C1), while doxorubicin was the positive control (D1–D3, E3). Q1, necrotic cells; Q2, cells in the stage of late apoptosis; Q3, viable cells; Q4, early apoptotic cells.