
Figures & data
Table 1. Primer sequences and conditions for RT-PCR.
Table 2. Group classification of C57BL/6 mice.
Table 3. Composition and physicochemical characteristic of WBP.
Figure 1. The FT-IR spectrum of WBP isolated from wheat bran.
Figure 2. The effects of WBP on cytokines secretion in RAW 264.7 cells. (a) RAW 264.7 cells were treated with WBP at the various concentrations for 24 h and the cell viability was determined using an MTT assay. (b–d) The RAW 264.7 cells were cultured with 12.5, 25, 50 or 100 μg ml–1 of WBP for 24 h. In order to rule out possible endotoxin contamination, WBP or LPS were pretreated with polymyxin B (100 μg ml–1) for 30 min before challenging RAW 264.7 cells. The level of NO was detected by Griess reagent; PGE2 and TNF-α were measured by ELISA kits. Each value is the mean ± standard deviation (n = 3). Any significant differences between polymyxin B-treated and -untreated groups were analyzed using the Student’s t-test (*p < 0.05).
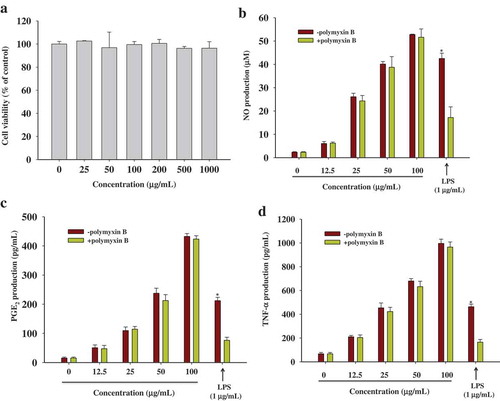
Figure 3. The effect of WBP on the expression of mRNAs of iNOS, COX-2, and TNF-α in RAW 264.7 cells. RAW 264.7 cells (5 × 10⁶ cells ml–1) were incubated with 100 μg ml–1 WBP for the indicated periods of time. Total RNA was isolated and the expression of iNOS, COX-2, and TNF-α was determined by semi-quantitative PCR as described in the text. A representative gel graph from three independent experiments was shown.
Figure 4. Effect of WBP on the nuclear translocation of NF-κB and AP-1. RAW 264.7 cells were transiently co-transfected with NF-κB-luc (a) or AP-1-luc (b). Forty-eight hours after transfection, cells were treated with the indicated concentrations of WBP (12.5–100 μg ml–1) for 1 h. Luciferase activities were determined by luminometry. Any significant differences between WBP-treated and control groups were analyzed using the Student’s t-test (*p < 0.05). (c) RAW264.7 cells (5 × 10⁶ cells ml–1) were incubated with 100 μg ml–1 WBP for the indicated periods of time. The nuclear fractions were collected and protein levels of c-Jun, c-fos, p65, and β-actin were determined by immunoblotting analysis as described in Materials and methods. A representative gel graph from three independent experiments was shown.
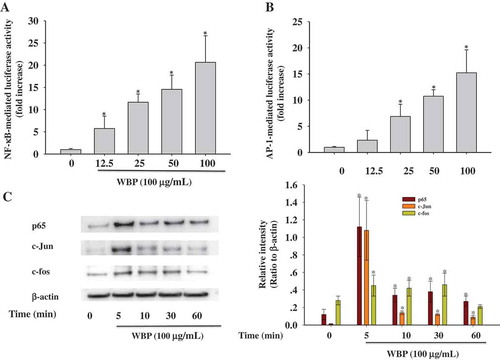
Figure 5. Effect of WBP on the activation of the upstream signaling pathways. RAW264.7 cells (5 × 10⁶ cells ml–1) were incubated with 100 μg ml–1 WBP for the indicated periods of time. (a) The whole-cell lysates were extracted for immunoblotting to determine the levels of phospho- or total MAPKs (ERK, p38, and JNK) identified based on their antibodies. (b) Inhibitory effects of specific inhibitors p38 MAPK kinase (SB203580) on iNOS, COX-2, and TNF-α expression in RAW 264.7 cells. Cells were pre-treated with SB203580 followed by stimulation with 100 μg ml–1 WBP for 6 h. Total RNA was isolated and real time-PCR was performed to determine the mRNA level of each gene with gene-specific primer. Within a column, any significant differences between p38 inhibitor-treated and -untreated groups were analyzed using the Student’s t-test (*p < 0.05). (c) RAW 264.7 cells (5 × 10⁶ cells ml–1) were incubated with 100 μg ml–1 WBP for the indicated periods of time. The whole-cell lysates were extracted for immunoblotting to determine the level of TLR4. (d) Inhibitory effects of anti-TLR4 on WBP-induced NO production in RAW 264.7 cells. Cells were treated with anti-TLR4 or control IgG fraction (10 μg ml–1) for 30 min followed by stimulation with different concentration of WBP (25, 50, or 100 μg ml–1) for 24 h. The level of NO was detected by Griess reagent. Any significant differences between treatments with anti-TLR4 and control antibody were analyzed using the Student’s t-test (*p < 0.05).
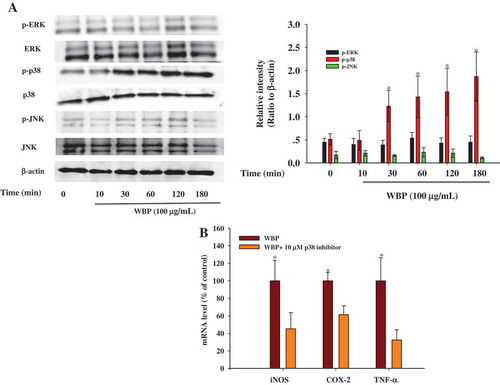
Figure 5. (continued)
Table 4. Effect of WBP on immune organ indices in the CTX-treated mice.
Table 5. Effect of WBP on cytokines secretion in in the CTX-treated mice.