Figures & data
Figure 1. Treatment with PTE inhibited lipid accumulation in 3T3-L1 adipocytes. Undifferentiated 3T3-L1 cells and their differentiated derivatives were used to determine the effect of 500 μg/mL PTE treatment on lipid accumulation (a), intracellular triglyceride content (b), lipase activity (c), and cytotoxicity (d). Percentages were calculated as relative to the adipocyte group without PTE treatment (Untreatment). Data are presented as mean ± SD. Significant differences from the control group are indicated by * p < 0.05, ** p < 0.01, and *** p < 0.001.
Figure 2. Treatment with PTE inhibited lipid accumulation in HFD-induced obese mice without altering food intake. Obese mice derived from HFD feeding for 4 weeks were divided into the HFD control group (n = 10) and PTE treatment group (n = 10). Mice in the HFD control group received distilled water, whereas mice in the PTE group were administered 250 mg/kg PTE orally daily for 5 weeks. The normal diet group (ND, n = 8) were fed a ND throughout the entire experiment period. (a) Phenotypes of mice in ND, HFD control, and PTE treatment groups. Scale bar = 4 cm. (b) Body weight (g) plot of each experimental group during the treatment period. (c) Average increased body weight (g) of each experimental group. (d) Body weight (%) plot at each measurement day relative to the first day of treatment during the experimental period. (e) Mean relative increased body weight (%) of each group after treatment for 5 weeks. (f) Weight of epididymal fat of mice in each experimental group after treatment for 5 weeks. (g) Amounts of food intake in the HFD control and PTE treatment groups. Data are presented as mean ± SEM. Significant differences between the ND group and HFD control group are indicated by #p < 0.05, ##p < 0.01, and ###p < 0.001. Significant differences between the PTE group and HFD control group are indicated by *p < 0.05, **p < 0.01, and ***p < 0.001.
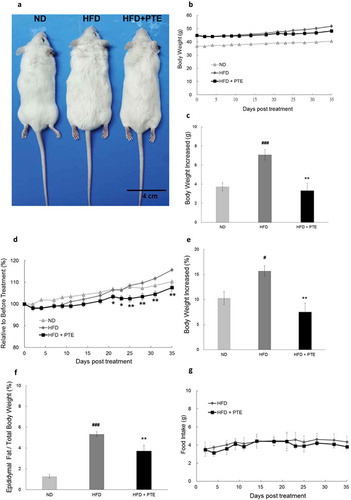
Figure 3. Treatment with PTE reduced serum triglyceride levels without producing hepatotoxicity or nephrotoxicity. Serum was collected from each experimental group and the following parameters were determined: alanine aminotransferase (ALT), aspartate aminotransferase (AST), nephrotoxicity indicator (creatinine), triglycerides, total cholesterol, and glucose. Data are presented as the mean ± SEM. Significant differences between the PTE treatment group and HFD control group are indicated by *p < 0.05, **p < 0.01, and ***p < 0.001.
Figure 4. Treatment with PTE attenuated HFD-induced liver lesion. Comparison of histopathological alterations of the liver in the ND, HFD control, and PTE groups. (a) Tissue sections were prepared and stained with hematoxylin and eosin. The sections were photographed at 100×, 200×, and 400× magnifications. Scale bars = 100, 50, and 20 μm at each magnification, respectively. (b) Quantification of liver lesion histology. Significant differences between ND and HFD group are indicated by ###p < 0.001; HFD and PTE group are indicated by ***p < 0.001.
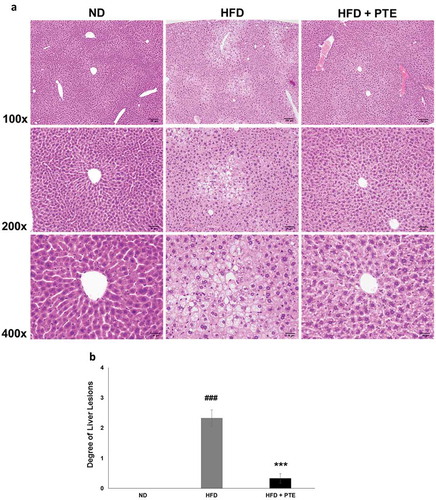
Table 1. Top 30 downregulated genes upon PTE treatment.
Table 2. Top 30 upregulated genes upon PTE treatment.
Table 3. Gene ontology (GO) analysis of the differential expression genes.
Table 4. Expression levels of gene encoding transcription factors involved in adipogenesis.
Figure 5. Confirmation of PTE-induced differentially expressed genes using real-time PCR. (a) The genes showing differential expression in the RNA-seq study were verified using real-time quantitative PCR. Expression of each gene was normalized to that of β-actin and hypoxanthine guanine phosphoribosyl transferase (HPRT) genes. (b) Dot plot displaying the relative degrees of differential expression of selected genes. Fold changes indicate the gene expression in the PTE treatment group relative to that in the HFD control group. Data are presented as the mean ± SEM. Significant differences between the ND group and HFD control group are indicated by #p < 0.05, ##p < 0.01, and ###p < 0.001. Significant differences between the PTE group and HFD control group are indicated by *p < 0.05, **p < 0.01, and ***p < 0.001.
Figure 5. Continued.
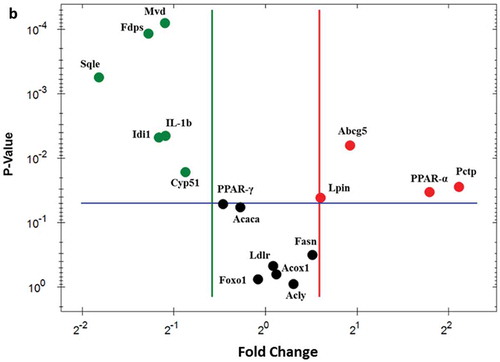
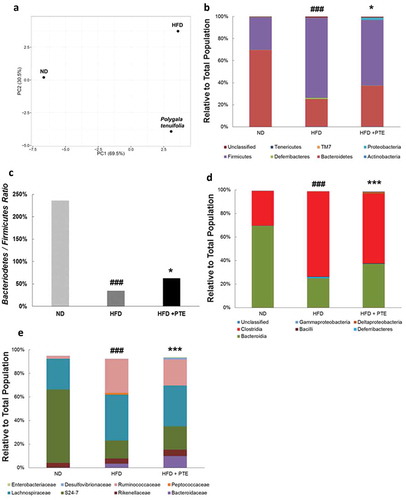
Figure 6. Gut microbiota profiles in HFD control and PTE-treated mice. (a) Diversity of gut microbiota in ND, HFD control, and PTE treatment groups was determined using principal component analysis. The dominant bacterial population in each group at the phylum level (b), class level (d), and family level (e) are shown. (c) Bacteroidetes to Firmicutes ratio of ND, HFD control, and PTE-treated mice. Significant differences between the ND group and HFD control are indicated by #p < 0.05, ##p < 0.01, and ###p < 0.001. Significant differences between the PTE group and HFD control are indicated by *p < 0.05, **p < 0.01, and ***p < 0.001.