Figures & data
Figure 1. Stained agarose gel electrophoresis of genomic DNA of brain. Control group (Lane 1 & 2) showed very low or undetectable DNA laddering (DNA fragmentation) compared to DNA marker (Lane 8, 1 kb). Silver nanoparticles alone (Lane 3 & 4) revealed DNA fragmentations which appear as DNA smearing. Iron oxide nanoparticles (Lane 5 & 6) showed very low brain genomic DNA fragmentation. The combination group (Lane 7) showed massive DNA fragmentations which appear as DNA smearing compared to DNA marker (Lane 8).
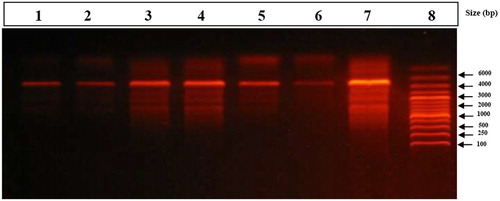
Table 1. The initial and final body weight, weight gain and brain weights (grams) of male rats exposed to iron oxide nanoparticles (Fe2O3NPs) and/or silver nanoparticles (AgNPs).
Figure 2. The expression of mtTFA (A) and PGC-1α (B) in brain tissues of rats exposed to iron oxide nanoparticles (Fe2O3NPs) and/or silver nanoparticles (AgNPs) (data presented as Mean±SE. Mean values that not sharing a common small letters (a,b,c) are significantly different, p < 0.05).
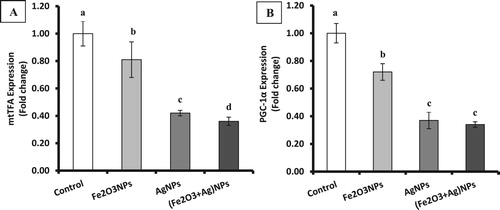
Figure 3. The levels of p53 (A), TNF-α (B) and IL-6 (C) in brain tissues of rats exposed to iron oxide nanoparticles (Fe2O3NPs) and/or silver nanoparticles (AgNPs) (data presented as Mean±SE. Mean values not sharing a common small letters (a,b,c) are significantly different, p < 0.05).
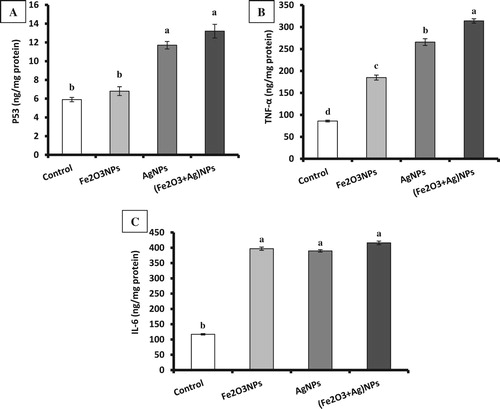
Table 2. Brain and plasma activities of acetylcholine esterase (AchE) and levels of acetylcholine (Ach), norepinephrine (NE), sertonine, and dopamine in male rats exposed to iron oxide nanoparticles (Fe2O3NPs) and/or silver nanoparticles (AgNPs).
Table 3. Brain levels of thiobarbituric acid-reactive substances (TBARS), nitric oxide (NO), glutathione (GSH), superoxide dismutase (SOD), catalase (CAT), glutathione S-transferase (GST), glutathione peroxidase (GPX) and total antioxidant capacity (TAC) in male rats exposed to iron oxide nanoparticles (Fe2O3NPs) and/or silver nanoparticles (AgNPs).
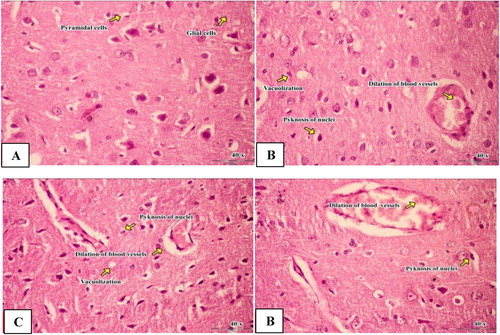
Figure 4. Light micrograph of brain of male rats. Control group (a) showed normal glial. Iron oxide nanoparticles group (b) revealed pericellular edema, dilation of blood vessels, vacuolization and pyknosis of nuclei. Silver nanoparticles group (c) revealed mild neuronal degeneration and pyknotic nuclei, pericellular edema, dilation of blood vessels and neuronal vacuolization. Combination group of iron oxide nanoparticles and silver nanoparticles (d) revealed neuronal degeneration and pyknotic nuclei, pericellular edema, dilation of blood vessels and neuronal vacuolization (H & E; X 40).