
Figures & data
Figure 1. Growth kinetic profile for amylase production and cell biomass by strain G. icigianus BITSNS038. Results represented as Mean ± standard deviation of triplicates.
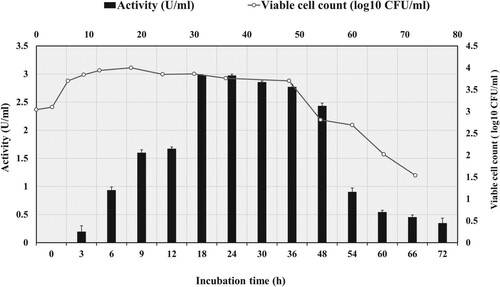
Figure 2. (A) Comparative graph showing experimental and predicted values of biomass formation of G. icigianus (B) Plot ln(X) vs. t showing variation of biomass formation in batch culture during the exponential phase of bacterial growth curve (C) Comparative graph showing experimental and predicted values of product formation (amylase activity) by G. icigianus (D) Regression analysis for product formation at t = 0, i.e. beginning of exponential phase
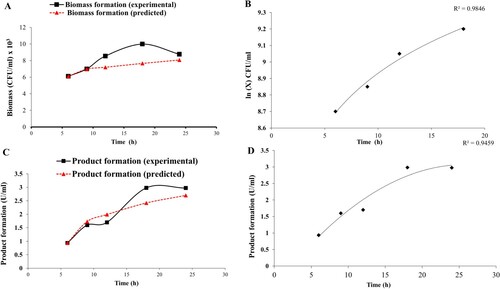
Table 1. Optimization condition achieved for each parameter after applying OFAT.
Figure 3. (A) Effect of different pH on amylase production. (B) Effect of different carbon sources on amylase production. (C) Effect of different concentrations of starch as carbon source on amylase production. (D) Effect of different concentrations of tryptone as nitrogen source on amylase production. Results represented as Mean ± standard deviation of triplicates. Statistical data represented as Punnet chart where ns represents no significant difference.
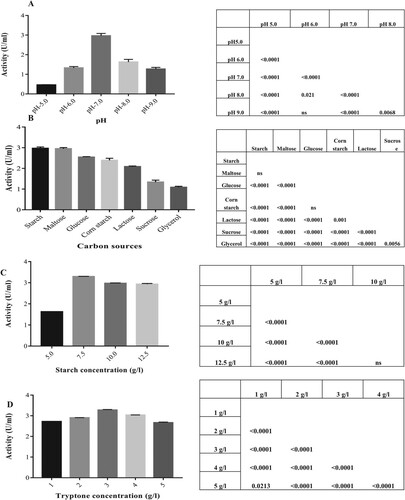
Figure 4. (A) Effect of different temperatures on amylase activity. Statistical data represented as Punnet chart where ns represents no significant difference (B) Effect of pH on amylase activity (C) Study on thermal stability of amylase at 60°C and 70°C. Results represented as Mean ± standard deviation of triplicates (D) Plot of ln (At/A0) vs. t for the determination of deactivation rate constant (Kd) (E) Lineweaver-Burk plot for the determination of Km and Vmax (F) Determination of α and β amylase in crude supernatant. Results represented as Mean ± standard deviation of triplicates.
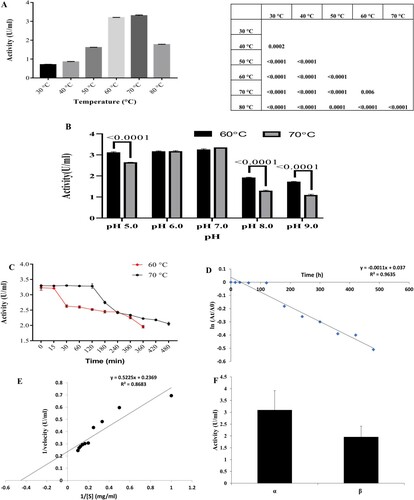
Table 2. Kinetic and thermostability parameters evaluated experimentally.
Figure 5. %Hydrolysis of corn starch. Results represented as Mean ± standard deviation of triplicates.
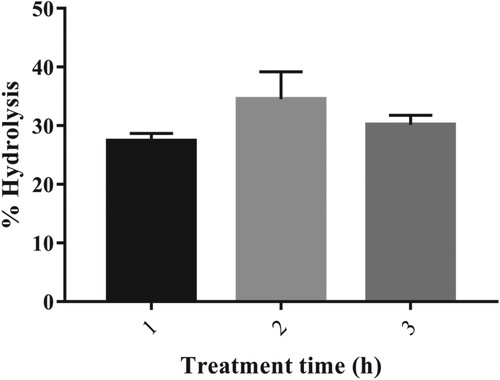
Figure 6. Agar well diffusion assay revealing the lack of antibacterial activity of amylase enzyme on (A) E. coli (B) P. aeruginosa (C) B. subtilis and (D) S. aureus. Wells E and C contained 100 µL of partially purified and crude amylase enzyme, respectively.
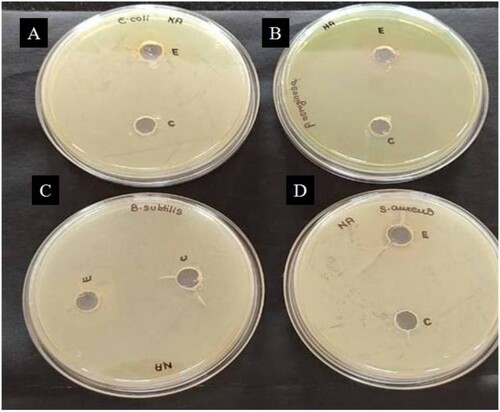
Figure 7. Agar well diffusion assay depicting no antifungal activity of amylase on (A) Sclerotium sp. and (B) Rhizoctonia sp.
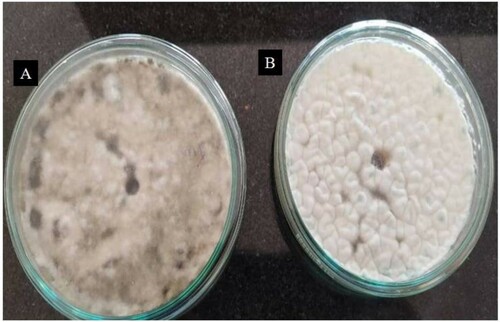
Figure 8. Antibiofilm activity of partially purified and crude amylase enzyme against two strains of EPS producing Bacillus sp. designated as (A) BITSNS010 (B) BITSNS018.
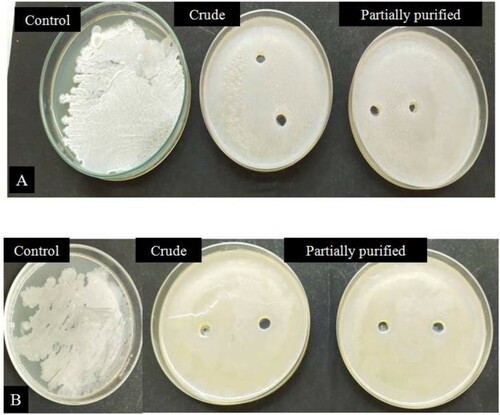
Figure 9. Molecular weight analysis of amylase enzyme using SDS-PAGE.
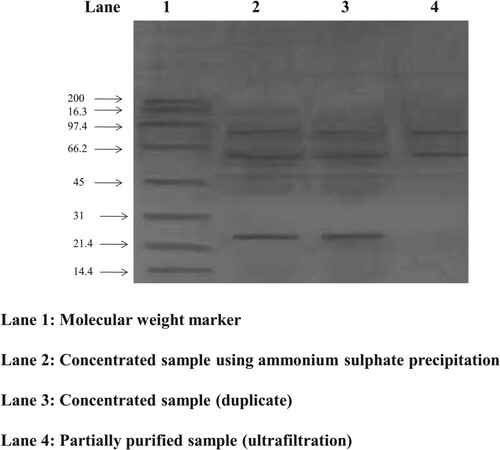
Table 3. Partial purification of amylase from G. icigianus (BITSNS038).
Table 4. The comparison of the present research reports with the present work on amylase along with their applications.