
Figures & data
Figure 1. Costus igneus plant.
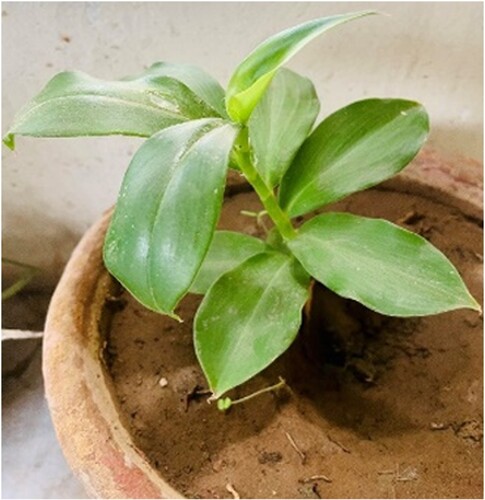
Figure 2. Therapeutic targets for diabetes mellitus and their underlying mechanisms: (a) IR, (b) DPP-IV, and (c) PPAR-γ.
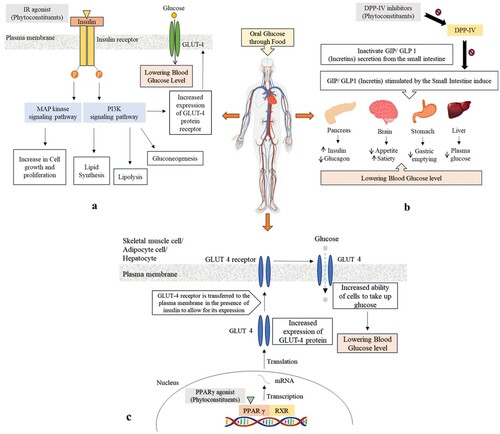
Table 1. Phytoconstituents’ dossier of physiochemical characteristics.
Figure 3. Human therapeutic target X-ray conformations of diabetes mellitus receptors. (a) IR (b) DPP-IV (c) PPAR-γ.
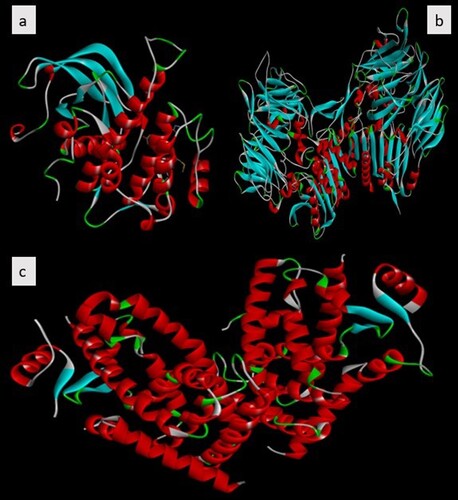
Figure 4. Graphical depiction of the binding energy of phytoconstituents against Diabetes mellitus targeted therapies highlighting foremost docked compounds similar to their reference counterpart (a) IR (b) DPP-IV (c) PPAR-γ.
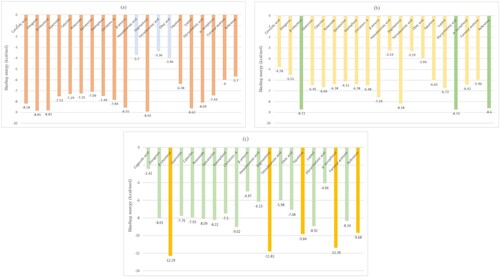
Table 2. The binding energy of phytoconstituents selected for docking towards diabetes mellitus targeted therapies.
Figure 5. 3D and 2D illustrations of foremost docked complexes (A) IR (B) DPP-IV (C)PPAR-γ
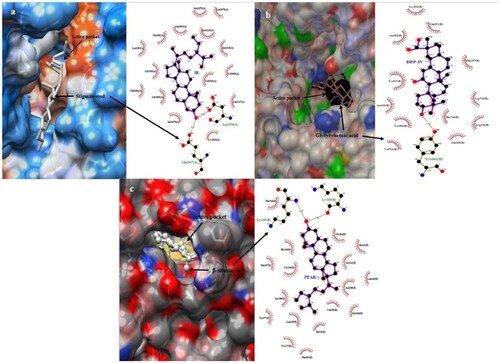
Figure 6. 2D depiction of the best-fitting ligand and reference with their corresponding receptors (a) IR (b) DPP-IV (c) PPAR-γ.
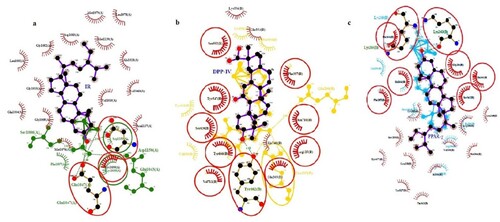
Figure 7. RMSD and RMSF plot of (a) Stigmasterol with IR (b) Glycyrrhetinic acid with DPP-IV (c) β-sitosterol with PPAR-γ.
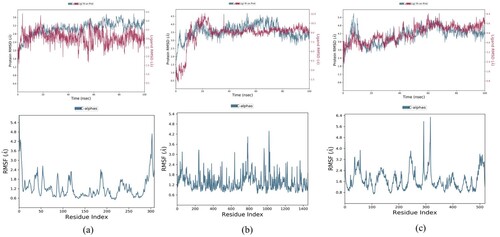
Figure 8. Ligand torsion profile of (a) Stigmasterol with IR (b) Glycyrrhetinic acid with DPP-IV (c) β-sitosterol with PPAR-γ.
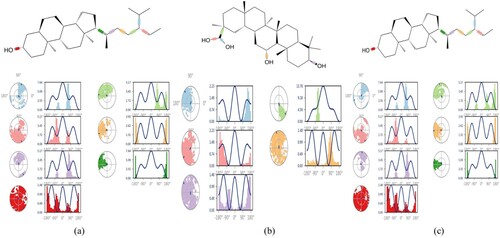
Figure 9. Protein–Ligand contact histogram and timeline representation (a) Stigmasterol–IR complex (b) Glycyrrhetinic acid–DPP-IV (c) β-sitosterol–PPAR-γ.
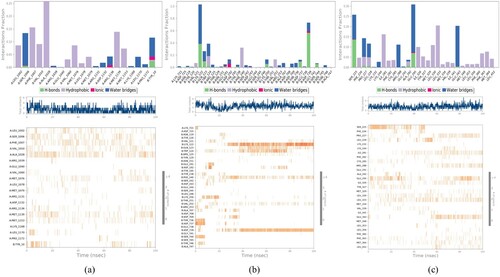
Table 3. Protein secondary structure elements (SSE) interpretation.