Figures & data
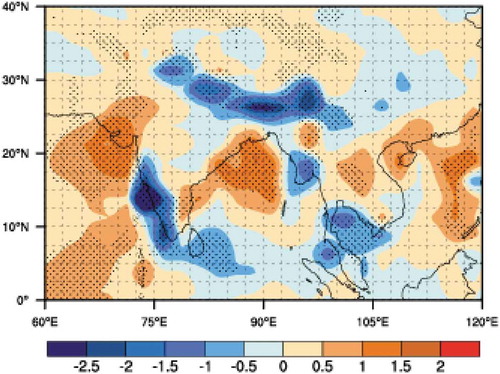
Figure 1. The (a–c) spatial structures and (d–f) time coefficients of the first three EOF modes for the SASM rainfall during 1979–2017.
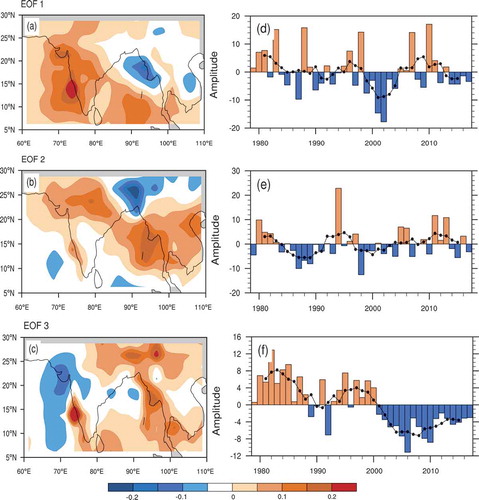
Figure 2. Difference in the (a) rainfall (units: mm) in south Asia, (b) 500-hPa omega (units: Pa s−1), and (c) OLR (units: W m−2) between 2001–2017 and 1979–2000. Negative values in (b, c) represent ascending motion anomalies. Dotted areas are significant at the 90% confidence level based on the Student’s t-test.
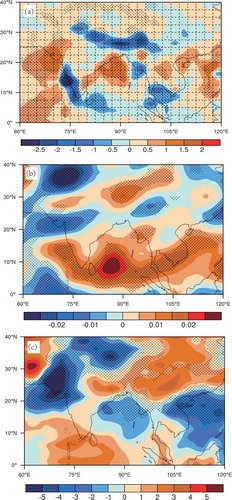
Figure 3. (a) Difference in the large-scale wind at 200 hPa and precipitation (shading) in the observation between 1979–2000 and 2001–2017, and (b–f) difference in the model output between the GA/TA/TIA/TPA/TAA and CTL simulations. Dotted areas represent significant values in the precipitation at the 90% confidence level based on the Student’s t-test.
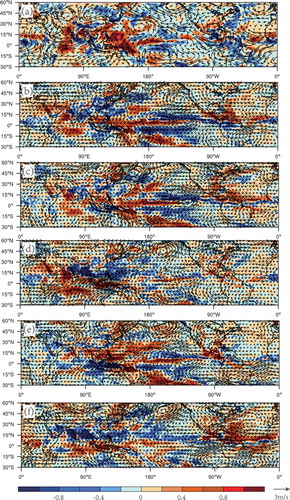
Figure 4. (a) Difference in the Walker circulation averaged over 10°S–10°N in the observation between 1979–2000 and 2001–2017, and (b–f) difference in the model output between the GA/TA/TIA/TPA/TAA and CTL simulations. Dotted areas represent significant values in the vertical or zonal wind velocity at the 90% confidence level based on the Student’s t-test.
Figure 5. (a) Difference in the regional Hadley circulation averaged over 75°–110°E in the observation between 1979–2000 and 2001–2017, and (b–f) difference in the model output between the GA/TA/TIA/TPA/TAA and CTL simulations. Dotted areas represent significant values in the vertical or meridional wind velocity at the 90% confidence level based on the Student’s t-test.