
Figures & data
Figure 1. Experimental set up for two point loading flexure test on beam.
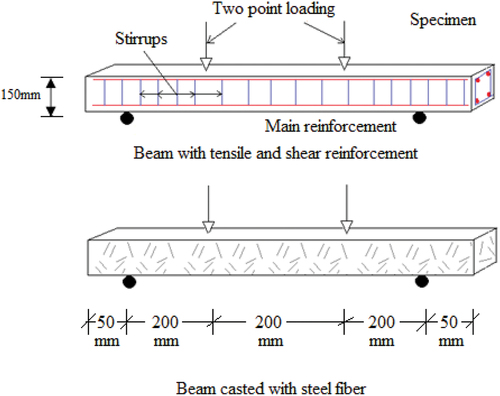
Table 1. Mathematical formulae for various statistical tests.
Table 2. Statistical tests results for GT: π01.
Table 3. Global performance indicator(GPI) for π01 with prediction of SFRC strength.
Table 4. Global performance indicator (GPI) for prediction of SFRC strength to determine the median.
Table 5. Prediction of SFRC strength parameter depending upon global performance indicator (GPI).
Table 6. Comparative analysis of the models using coefficient of determinants(R2) and GPI.
Figure 2. Failure pattern of beam under flexure with two point loading.
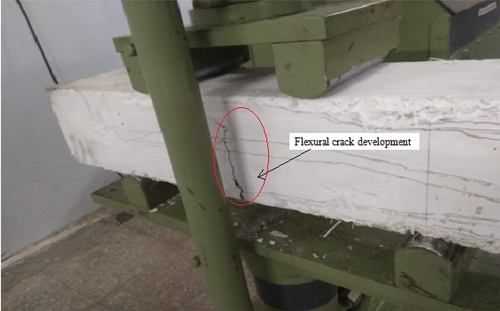
Figure 3. Compressive strength after 7 days with experimental, theoretical and calculated values.
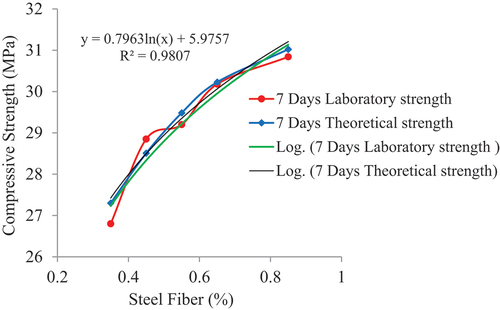
Figure 4. Compressive strength after 28 days with experimental, theoretical and calculated values.
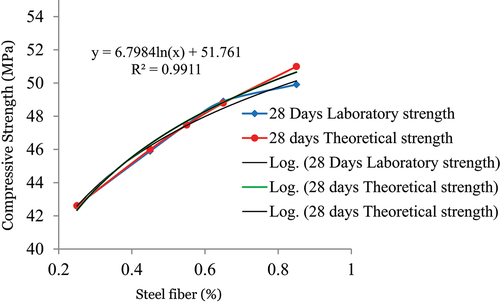
Figure 5. Flexural strength after 7 days with experimental and theoretical values.
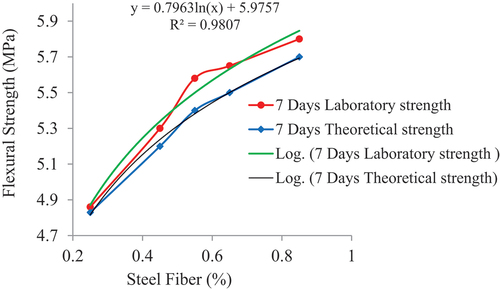
Figure 6. Flexural strength after days with experimental and theoretical values.
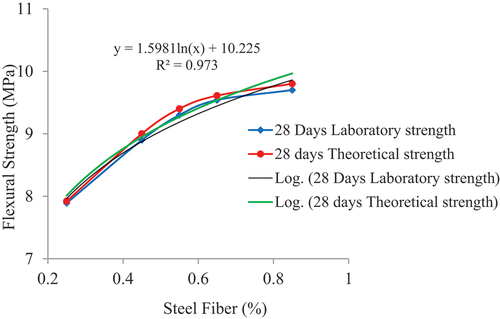
Table 7. Results of error analysis and global performance indicator showing the best mode for all response variables.