Figures & data
Figure 1. (a) XRD for BFS (b) FTIR for AH dry powders (c) SEM For NF.
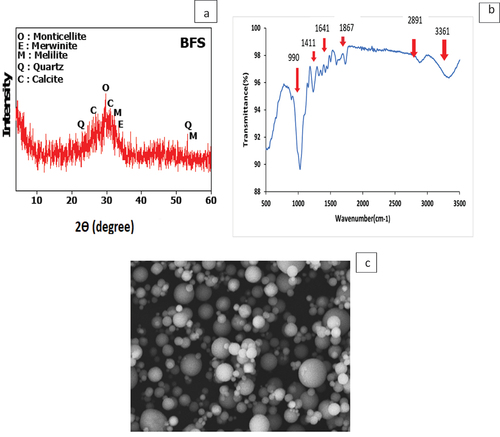
Table 1. Chemical oxide % of BFS and AH.
Table 2. GP notation and their composition.
Figure 2. Setting time of prepared GP pastes.
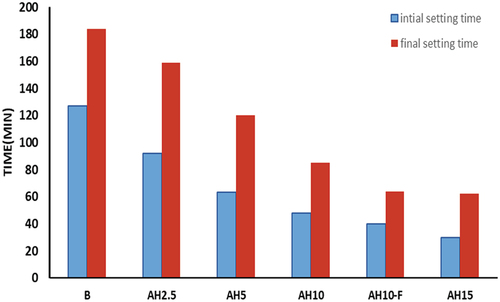
Figure 3. Compressive strength of the different GP samples when curing at (a) room temperature, (b) 60°C/0.02MPa.
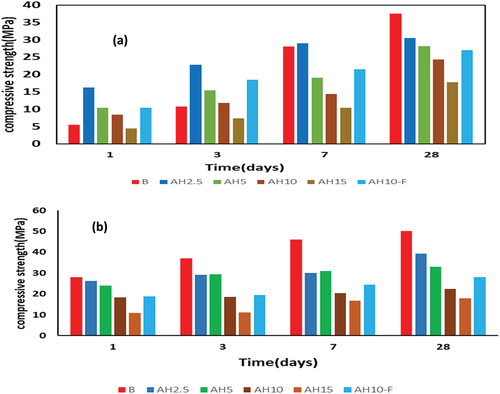
Figure 4. RS% for GP after firring at 300,600 and 800°C a) cured at room temperature, b) hydrothermal cured at 60°C/0.02MPa.
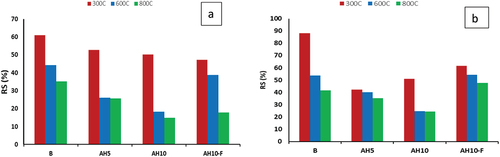
Figure 5. RS% for GP after immersion in sulfuric acid (5%) for 15,30,45 and 60 days a)curing at room temperature for 28 days. B) curing at 60° C/0.02MPa for 28 days.
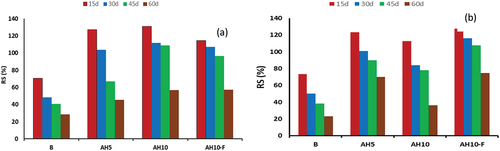
Figure 6. TG/DTG curves of B and AH10 samples that normally cured for 28 days at room temperature.
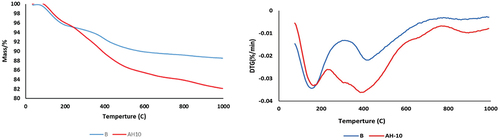
Table 3. Weight loss % for B & AH10 mixes at various temperature stages.
Figure 7. XRD for GP curing at 60° C, after curing for 3 and 28 days.
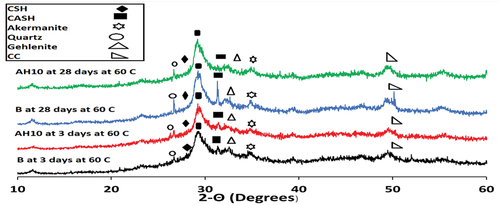
Figure 8. XRD for GP curing at 60° C/0.02MPa, after firring at 300° C and 800 °C for 3 hours.
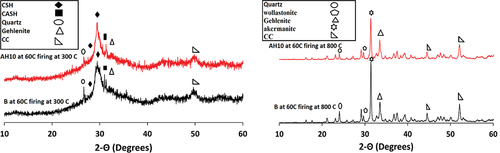
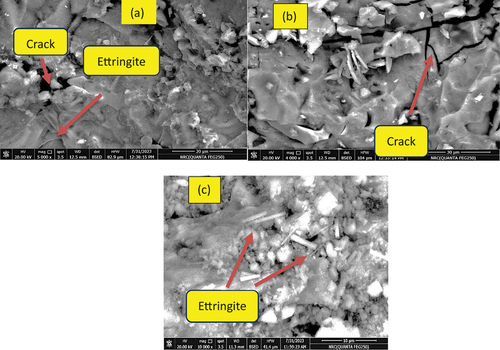
Figure 9. SEM images for GP hydrothermal cured after 28 days for (a)B,(b) AH10 and (c)AH10-F.
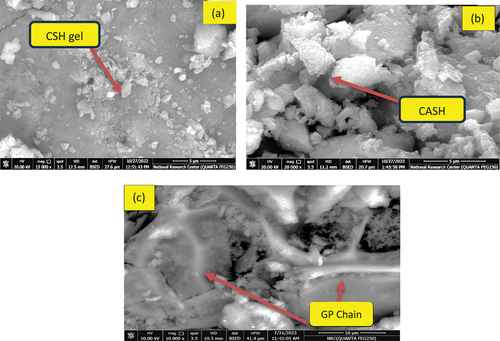
Figure 10. SEM images for firing at 800°C for (a)B,(b) AH10 and (c)AH10-F.
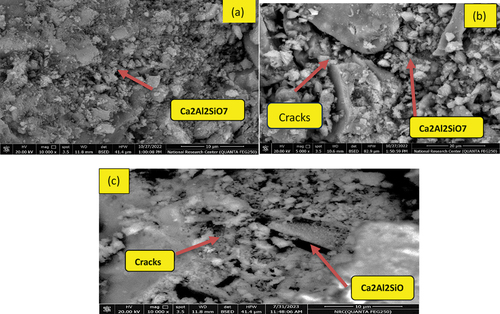
Figure 11. SEM images for immersed in sulfuric acid (1.5N) for 60 days for (a)B,(b) AH10 and (c)AH10-F.