Figures & data
Figure 1. Schematic of EIT measurement configuration: a circular domain with two symmetric circular anomalies. Here σ denotes the conductivity field and (
) represents different values of the conductivity field.
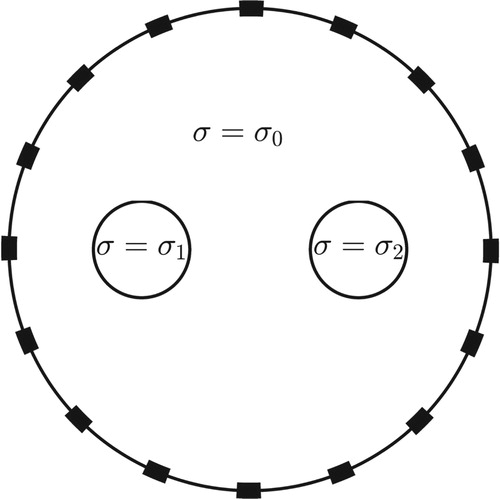
Figure 2. Illustration of shape detection indices. Red circles: electrodes; brown lines: 16 lines from centre of the anomaly to the electrodes; green and red outlines: shapes constructed by local minimum conductivities and maximum derivatives of conductivity in the direction of line
, respectively; black line: anomaly boundary. Note that the figure is based on the reconstructed image for a single anomaly in a circular domain without measurement errors.
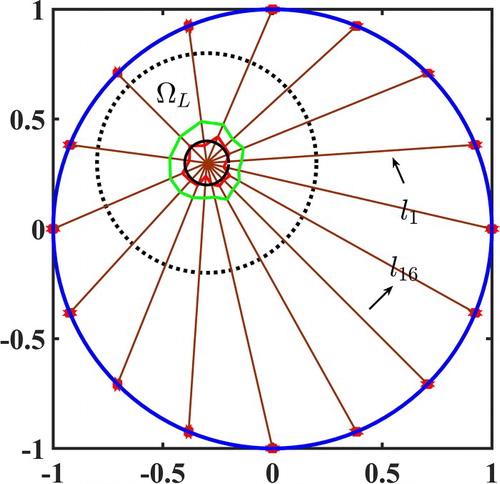
Figure 3. EIT reconstruction for single circular anomaly in circular domain: (a) model configuration and (b) reconstruction without measurement errors.
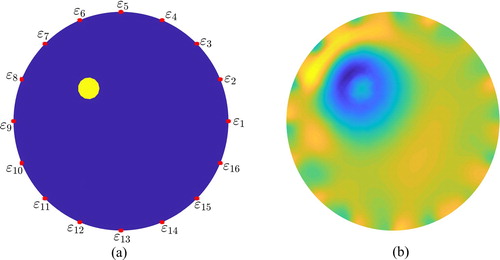
Figure 4. Reconstructed images of different detection indices for the case of a single anomaly in a circular domain.
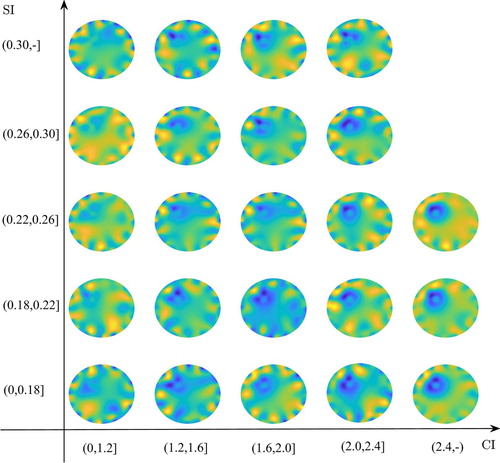
Figure 5. Success rates depending on standard deviation of the device error a. Success rate denotes the rate of successful image reconstruction in trials. The blue dotted lines are used to show the position of the case with
success rate, which is denoted by the intersection point between the dotted lines and red solid line.
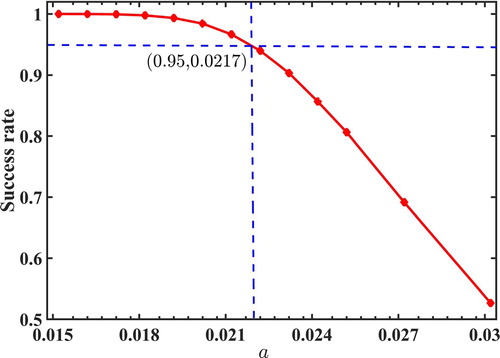
Figure 6. Results of cGSA for shape detection indices of the case with single anomaly in circular domain depending on standard deviation of device error a: (a) CI and (b) SI.
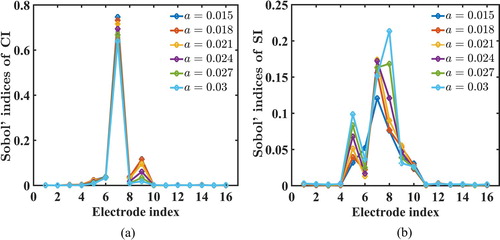
Figure 7. EIT reconstruction of two circular anomalies in circular domain: (a) model configuration and (b) reconstruction without measurement errors.
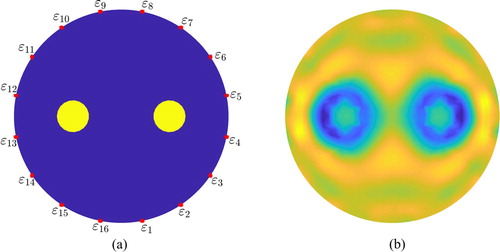
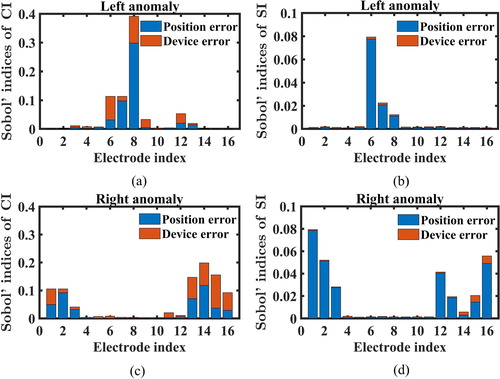
Figure 8. Results of cGSA for shape detection indices of the case with two anomalies in circular domain: (a) CI and (b) SI of left anomaly, and (c) CI and (d) SI of right anomaly. The electrode index is described in Figure (a).
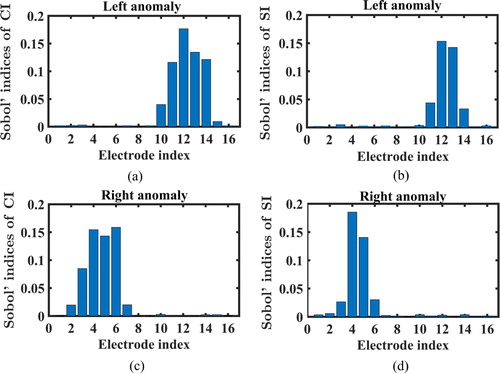
Figure 9. Meshes used in forward solver: (a) original and (b) adaptive meshes. Note that the red plus signs and blue asterisks denote the original and perturbed electrode positions, respectively, and the yellow region indicates that the meshes were adapted to the electrode positions.
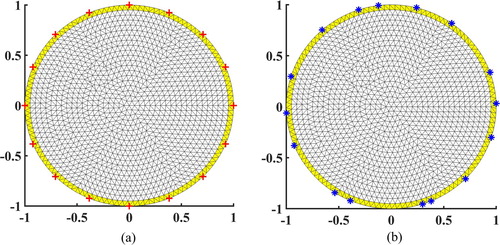
Figure 10. EIT reconstructed images of single anomaly in circular domain at different position and device errors. The horizontal and vertical axes represent the perturbed percentages of the measured potential caused by the device errors and of the electrode location caused by the position errors, respectively.
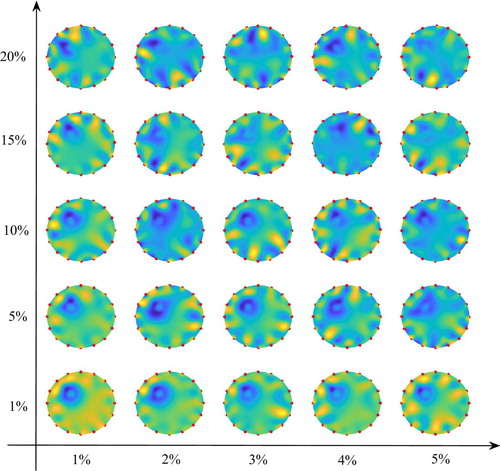
Figure 11. Results of cGSA for shape detection indices in the case with single anomaly in circular domain: (a) CI and (b) SI. Note that the height of each bar is the sum of the Sobol' indices of the position and device errors.
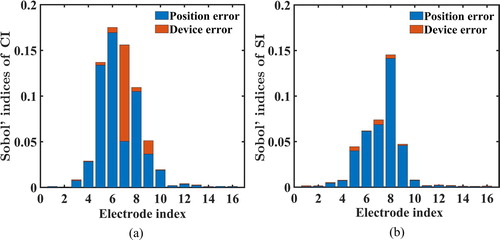
Figure 12. EIT reconstruction for two circular anomalies in body-like domain: (a) model configuration, and (b) reconstruction without measurement errors.
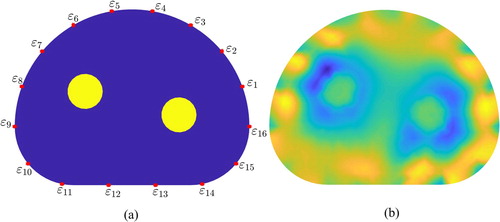
Figure 13. Results of cGSA for shape detection indices in the case with two anomalies in body-like domain: (a) CI and (b) SI of left anomaly, and (c) CI and (d) SI of right anomaly. The electrode index is described in Figure (a). Note that the height of each bar is the sum of the Sobol' indices of the position and device errors.