
Figures & data
Figure 1. Schematic representation of neuronal signaling. Integration of dendritic input results in generation of an action potential that travels via the axon to the presynaptic terminal, where the neuron makes contact with the postsynaptic neuron (left side of picture). Arrows depict travel direction of action potential. When an action potential reaches the presynaptic terminal, Ca2+ influx via voltage-gated calcium channels (VGCC) triggers the fusion of vesicles loaded with neurotransmitter with the cell membrane, thereby releasing neurotransmitter in the synaptic cleft (right side of picture, top part). Neurotransmitters can bind to ionotropic receptors that undergo a confirmation change upon binding allowing for the passage of ions through the channel (right bottom half, left receptor). Neurotransmitters can also bind to metabotropic receptors (right receptor). Upon binding, this receptor activates a G-protein complex that then activates an enzyme. This enzyme either activates a second messenger system that triggers cellular responses or opens an ion channel. Most of these processes can be subject to modulation by drugs, potentially resulting in seizure induction
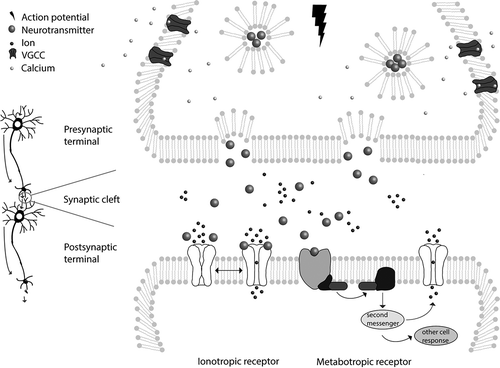
Table 1. Overview of a selection of known seizurogenic compounds with their targets and potential to cause seizures in rodents and/or humans. Adapted from [Citation28]
Figure 2. MEA plates have an electrode grid on the bottom on top of which (neuronal) cells can be cultured (left) for noninvasive recordings of electrical activity. Recorded activity can be depicted in a raster plot (right) that illustrates the major MEA metric parameters. The example raster plot depicts the activity of a human iPSC-derived neuronal co-culture at 16 electrodes (horizontal lines) in a single well, where each tick mark (red circle) depicts one spike in a ~ 100 s recording window. An example of a burst is encircled in green and network burst in orange. Burst duration and network burst duration are depicted with a green and orange arrow, respectively, whereas an inter-burst-interval (IBI) is marked with a purple arrow. The cumulative trace above the raster plots indicates the synchronized activity between the different electrodes. The blue circle thus represents the level of synchronicity
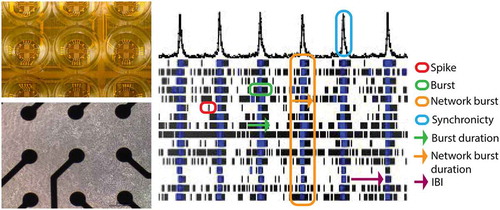
Table 2. Different metric parameters obtained from MEA measurements. Adapted from [Citation77]