
Figures & data
Table 1. A single 22 contingency table for a drug(i)-AE(j) pair in SRS for the number of reports given by counts and the associated probabilities.
Table 2. Probabilistic Interpretations and estimators of association for the 22 contingency table in SRS analysis.
Figure 1. Flowchart outlining a standard disproportionality analysis for data obtained from SRS.
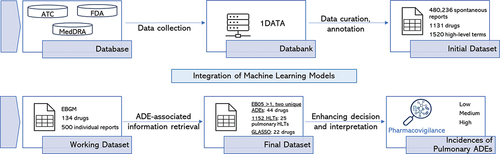
Figure 2. Global trends in PhV publications from 2003 to 2023. The purple bars indicate the number of publications in each given year, highlighted by the y-axis on the left-hand side. The red line corresponding to the y-axis on the right-hand side represent the cumulative number of publications from 2003 to 2023.
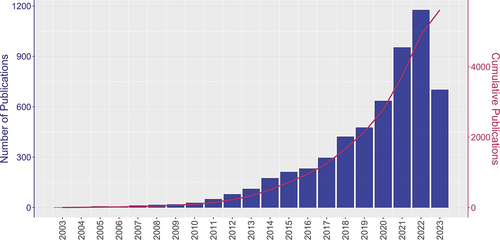
Figure 3. The network structure (Top) and density plots (Bottom) of bibliometric analysis for the abstracts of PhV-related publications.
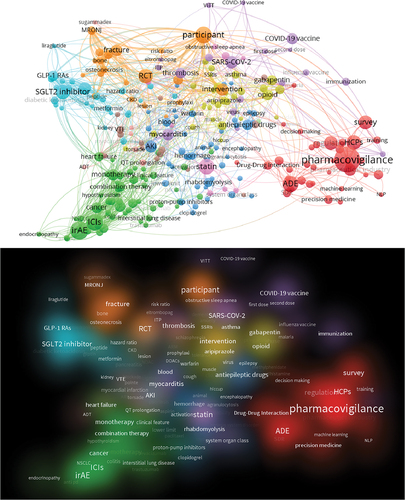
Figure 4. Framework for assessing potential risks associated with multidrug-related system organ class toxicity in pharmacovigilance analytics.
Data availability statement
For original data, please contact the corresponding author, Majid Jaberi-Douraki, [email protected].