Figures & data
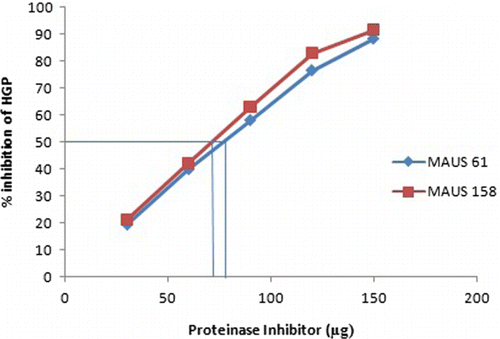
Figure 1. Graph showing IC50 value Soybean varieties for HGP.
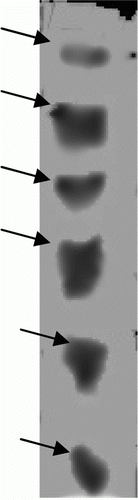
Table 1. Percent inhibition of trypsin and chymotrypsin activity.
Figure 2. Isoforms of proteases from crude HGP.
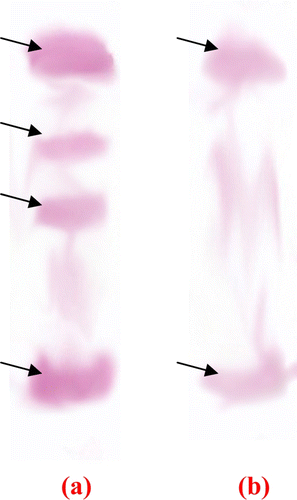
Table 2. Percent inhibition of HGP by crude and F1 fraction.
Table 3. Specific activity and yield of proteinase inhibitors after each step of partial purification.
Figure 3. Isoforms of specific trypsin and chymotrypsin proteases using overlay technique. (a) Trypsin like proteases (using BApNA substrate) and (b) chymotrypsin like proteases (using SAALpNA substrate).
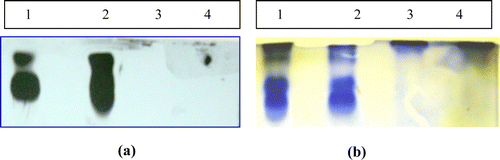
Figure 4. (a) Gel–X-ray film contact technique and (b) zymography. Lanes 1 and 3 corresponds to the F1 and F2 saturated fraction of soybean cultivar MAUS-158. Lanes 2 and 4 corresponds to the F1 and F2 saturated fraction of soybean cultivar MAUS-61.
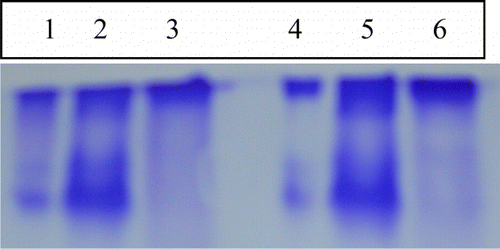
Figure 5. Visualization of chymotrypsin-inhibiting isoforms from soybean using zymography. Lane 1, crude; Lane 2, F1 fraction; Lane 3, F2 fraction soybean cultivar MAUS-158; Lane 4, crude; Lane 5, F1 fraction; and Lane 6, F2 fraction from MAUS-61 cultivar.
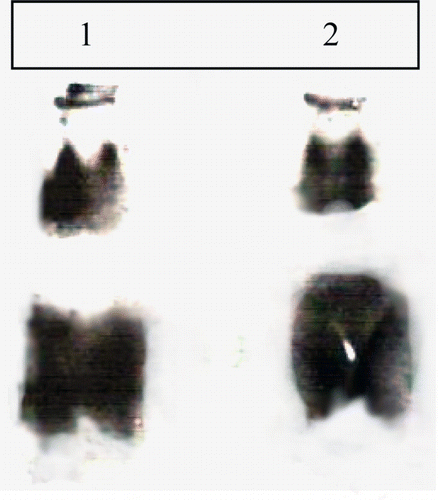
Figure 6. Visualization HGPI isoforms of soybean using Gel–X-ray film contact technique. (1) F1 fraction of MAUS 158 and (2) F1 fraction of MAUS 61.