Figures & data
Figure 1. Indexing of pink color intensity in Celosia leaves. The scores of the pink color intensity were rated by indexing from 0 to 4. 0: represents the lowest pink-colored leaf sample and 4: represents the highest pink-colored leaf sample.
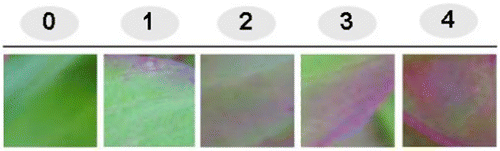
Table 1. Real time PCR amplification steps.
Figure 2. Real-time RT-PCR detection of methylobacterial type Fe-siderophore receptor transcript. Expression level of siderophore receptor gene was analyzed in five differentially indexed leaf samples using iQ SYBR Green dye (provided by Bio Rad, USA) on Miniopticon Real Time PCR Detection system (Bio Rad, USA). S: represents the test sample; 0–4: represents the indexing number of leaf samples. Data presented as the mean values of two replicates±SD.
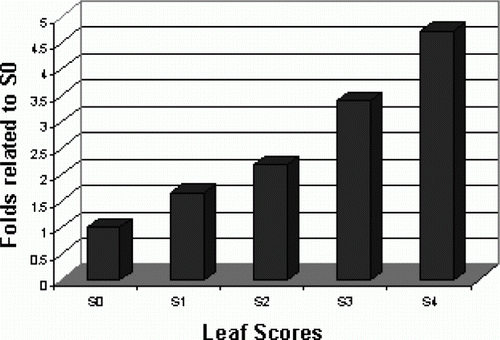
Figure 3. Prediction of methylobacterial cell count ratio. Methylobacterial attendance and rates in the leaves of the Celosia plant were predicted to be consistent to the levels of the specific target gene expression in the test leaf samples.
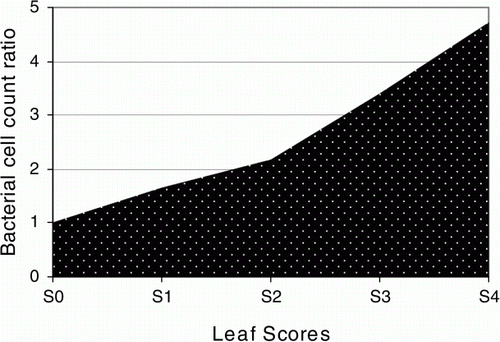
Figure 4. Detection of the total flavonoid contents in relation to target gene expression levels. (Left) total flavonoid contents were determined using aluminum chloride method by measuring the absorbance of the samples at 510 nm. (Right) target gene expression levels of the differentially indexed samples were plotted against their total flavonoid contents.
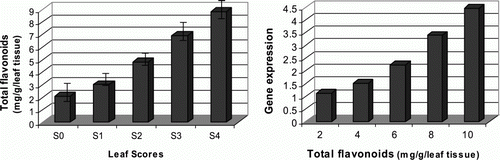
Figure 5. Detection of the total carotenoid contents in relation to target gene expression levels. (Left) total carotenoid contents were assessed using acetone and petroleum ether as extracting solvents and measuring the absorbance of the samples at 450 nm. (Right) target gene expression levels were plotted against total carotenoid contents of the differentially indexed leaf samples. All data were presented as the mean values of two replicates±SD.
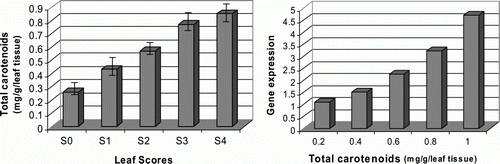
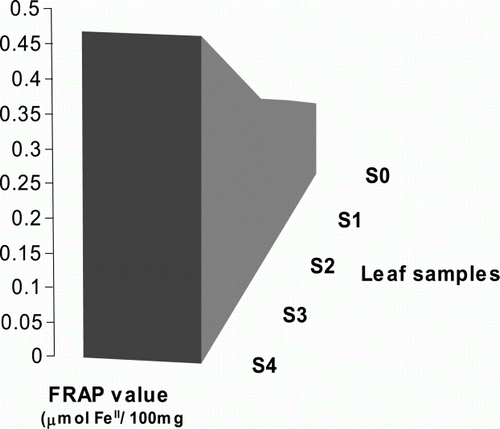
Figure 6. Assessment of the total antioxidant capacity. The total antioxidant abilities of the differentially indexed leaf samples (S0–S4) were assessed using FRAP method by measuring the absorbance of the test samples at A593. All data were presented as the mean values of two replicates±SD.