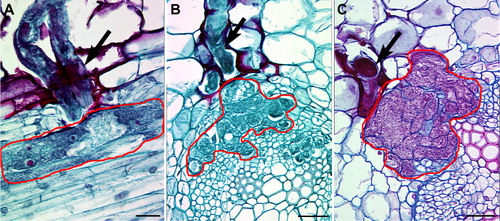
Figure 1. Specialization of cell types during plant–nematode interaction. A, a syncytium formed during a compatible interaction between the soybean cyst nematode (H. glycines) and soybean (G. max), three days post infection (dpi), bar = 25 µm; B, 6 dpi, bar = 50 µm; C, 9 dpi, bar = 50 µm, (this image is taken from the same series of sections, but is different than Matsye et al. Citation2012). The red line surrounding some cells represents the boundary of the syncytium whose development is engaged by the nematode. Black arrow represents the nematode.
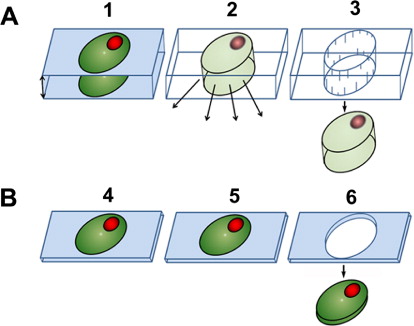
Figure 2. Loss of biological information during LM. A, embedded in paraffin: 1, a cell, represented in dark green with a red nucleus is embedded in paraffin as a support medium. The vertical arrow represents a 4 µm limit of sectioning. 2, paraffin is dissolved away with the loss of biological information represented in the cell and nucleus having lighter hues and arrows showing the loss of molecules out of the cell. 3, the cell after LM. B, embedded in pTechnovit 9100: 4, a cell, represented in dark green with a red nucleus is embedded in plastic as a support medium. 5, Plastic does not have to be etched away because both visualization and sectioning can be done effectively without that step, thus, no loss of biological molecules. 6, pe-LM of an ultrathin section containing a cell. The pe-LM procedure vaporizes neighboring cells while allowing for the collection of the desired cell.
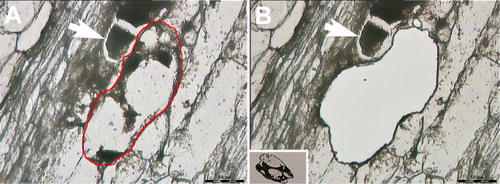
Figure 3. pe-LM of a nurse cell (giant cell) formed by the root knot nematode (Meloidogyne incognita) in cotton (Gossypium hirsutum). A, Before LM. B, After LM, inset, the captured cell that was dissected out in B. Bar = 50 µm.
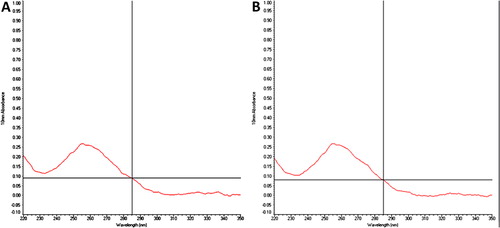
Figure 4. RNA quality. The x-axis represents wavelength and the y-axis represents absorbance. A, Diluted RNA isolated from a whole root sample, A260/A280 = 2.33, A260/230 = 2.37, 10.1 ng/µl. B, RNA isolated from 50 pe-LM obtained cells sectioned at 0.8 µm thickness, A260/A280 = 2.36, A260/230 = 2.10, 10.1 ng/µl.
Matsye PD, Lawrence GW, Youssef RM, Kim K-H, Matthews BF, Lawrence KS, Klink VP. 2012. The expression of a naturally occurring, truncated allele of an α-SNAP gene suppresses plant parasitic nematode infection. Plant Mol Biol. 80:131–155. 10.1007/s11103-012-9932-z