Figures & data
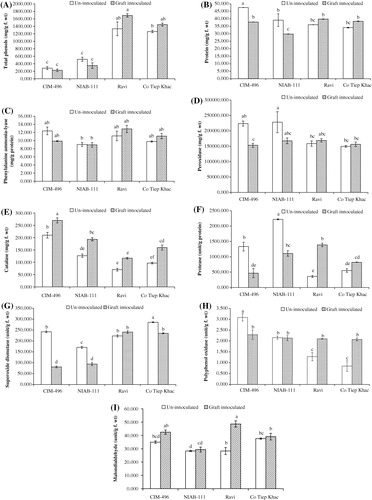
![Figure 1. (A) Total phenolics, (B) total soluble proteins, (C) phenylalanine ammonia-lyase, (D) peroxidase, (E) catalase, (F) proteases, (G) superoxide dismutase, (H) polyphenol oxidase, and (I) malondialdehyde of healthy and CLCuBV infected plants of susceptible and resistant cotton genotypes. Different letters on the top of bars indicate significant differences between genotypes for each treatment at P ≤ 0.05.](/cms/asset/9d2bdd5d-1e20-468e-aaa4-b0b7f03ee582/tjpi_a_905800_f0001_b.jpg)
Register now or learn more
Open access
People also read lists articles that other readers of this article have read.
Recommended articles lists articles that we recommend and is powered by our AI driven recommendation engine.
Cited by lists all citing articles based on Crossref citations.
Articles with the Crossref icon will open in a new tab.