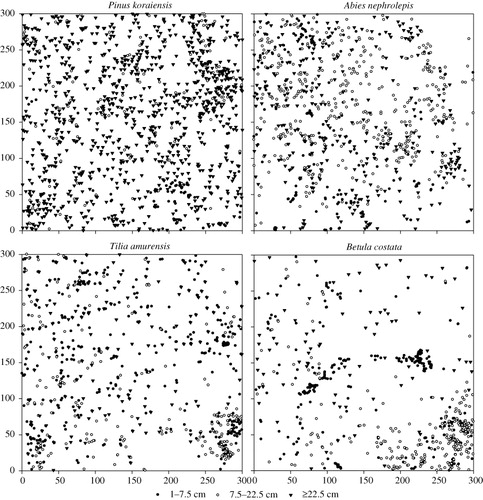
Figure 2. Spatial distribution of four species of the study plot.
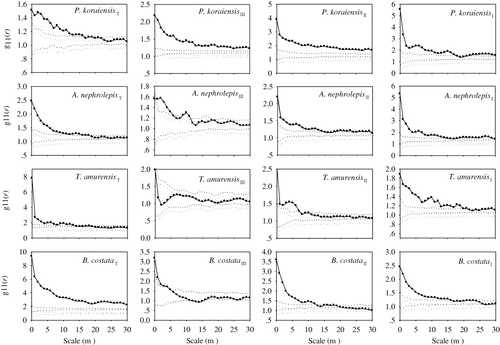
Figure 3. Univariate point pattern analyses of four species using point pattern analysis method g(r). The insets show the analyses of the point pattern of different life-history stages (T: Total, I: juveniles, 1 cm ≤ DBH < 7.5 cm; II: adult trees, 7.5 cm ≤ DBH < 22.5 cm; III: canopy trees, DBH ≥ 22.5 cm). Black lines indicate ring statistics (g(r)); thin dashed lines indicate the upper and lower limits of the 99% confidence envelope. Points above the upper envelope indicate clumped, within the envelopes random, and below regular.
Figure 4. Analyses of the association of four species in the study plot. The bivariate statistic of the pair-correlation function was used to analyze the spatial associations among four species under the CSR null model. The insets show the analyses of the point pattern of different life-history stages (T: Total, I: juveniles, 1 cm ≤ DBH < 7.5 cm; II: adult trees, 7.5 cm ≤ DBH < 2.5 cm; III: canopy trees, DBH ≥ 22.5 cm). Black lines indicate ring statistics (g(r)); thin dashed lines indicate the upper and lower limits of the 99% confidence envelope. Points above the upper envelope indicate clumped, within the envelopes random, and below regular.