Reducing carbon: phosphorus ratio can enhance microbial phytin mineralization and lessen competition with maize for phosphorus
Lin ZhangCollege of Resources and Environmental Sciences, China Agricultural University, Beijing100193, People's Republic of ChinaView further author information
,
Xiaodong DingCollege of Resources and Environmental Sciences, China Agricultural University, Beijing100193, People's Republic of China;College of Resources and Environment, Qingdao Agricultural University, Qingdao266109, People's Republic of ChinaView further author information
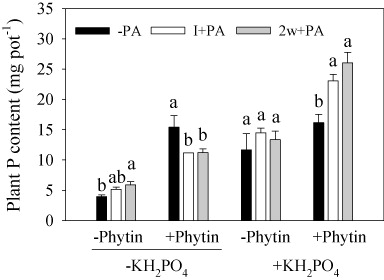
Figure 1. Plant P content of maize (Z. mays L.) under three bacterial inoculation treatments with (+) and without (−) phytin or KH2PO4 addition. –PA, no inoculation with PA; I+PA, inoculation with PA at seedling initiation; 2w+PA, inoculation with PA two weeks after seedling emergence. Different lowercase letters indicate a significant difference (Tukey's HSD, P < 0.05) in P content among the three inoculation forms. Bars represent means + SEs (n = 4).
Table 2. Increase in plant P content and phytin P use efficiency in plants grown in phytin amended soil with additional KH2PO4 or not.
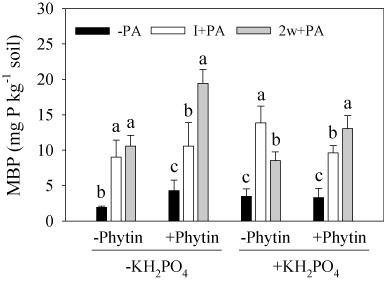
Figure 2. MBP in the rhizosphere soil under three bacterial inoculation treatments with (+) and without (−) phytin or KH2PO4 addition. –PA, no inoculation with PA; I+PA, inoculation with PA at seedling initiation; 2w+PA, inoculation with PA two weeks after seedling emergence. Different lowercase letters indicate significant difference (Tukey's HSD, P < 0.05) in MBP among the three inoculation forms. Bars represent means + SEs (n = 4).
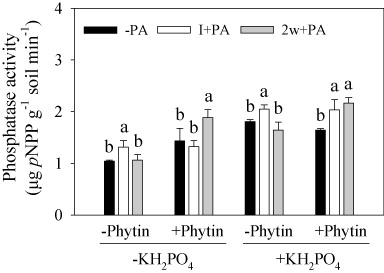
Figure 3. Phosphatase activity in the rhizosphere soil under three bacterial inoculation treatments with (+) and without (−) phytin or KH2PO4 addition. –PA, no inoculation with PA; I+PA, inoculation with PA at seedling initiation; 2w+PA, inoculation with PA two weeks after seedling emergence. Different lowercase letters indicate a significant difference (Tukey's HSD, P < 0.05) in phosphatase activity among the three inoculation forms. Bars represent means + SEs (n = 4).
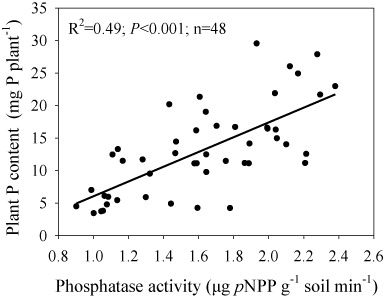
Figure 4. Correlation between phosphatase activity and plant P content. Each dot inside the figure represents each pot in the experiment. The data were fitted by significant regressions (plant P content = −5.3+11.4 phosphatase activity).