Kohji NishimuraDepartment of Molecular and Functional Genomics, Interdisciplinary Center for Science Research, Organization of Research, Shimane University, Nishikawatsu 1060, Matsue690-8504, JapanView further author information
Kenji MatsuiDepartment of Applied Molecular Bioscience, Graduate School of Medicine, Yamaguchi University, Yamaguchi753-8515, Japan;Department of Biological Chemistry, Faculty of Agriculture, Yamaguchi University, Yamaguchi753-8515, JapanCorrespondence[email protected] View further author information
Pages 1-10
|
Received 21 Nov 2014, Accepted 13 Dec 2014, Published online: 28 Jan 2015
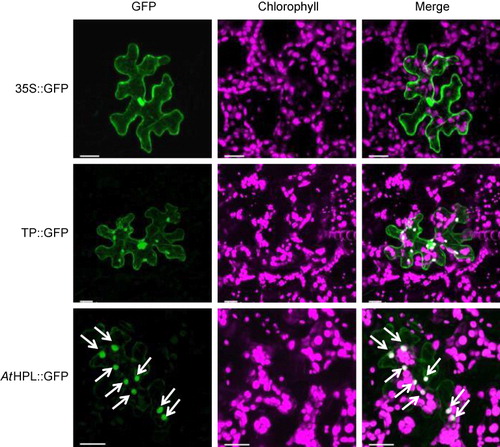
Figure 1. Subcellular localization of the AtHPL::GFP fusion protein under the control of the CaMV 35S promoter. 35S::GFP, 35S::TP::GFP (positive controls) and 35S::AtHPL::GFP fusion proteins were expressed transiently in Arabidopsis leaves using the particle gun bombardment technique. Expression was monitored using confocal microscopy. AtHPL::GFP was expressed in the chloroplasts on the epidermal surface of A. thaliana leaves, as observed in the merged images. White arrows mark chloroplasts expressing AtHPL::GFP. Magenta depicts autofluorescence of chlorophyll. Scale bar is 20 µm.
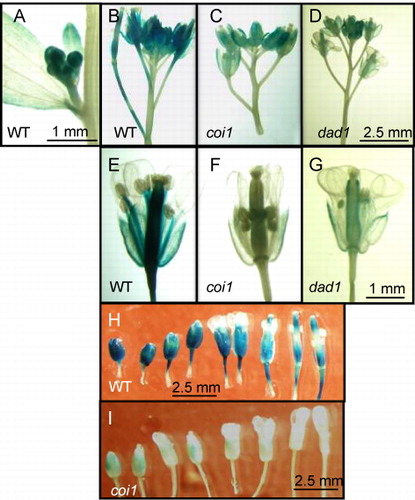
Figure 2. GUS activity in floral organs of transgenic A. thaliana plants. GUS activity derived from pAtHPL::GUS in floral organs of wild-type (Col-0) Arabidopsis (A, B, E, H), coi1(C, F, I), and dad1 (D, G) was detected with GUS staining.
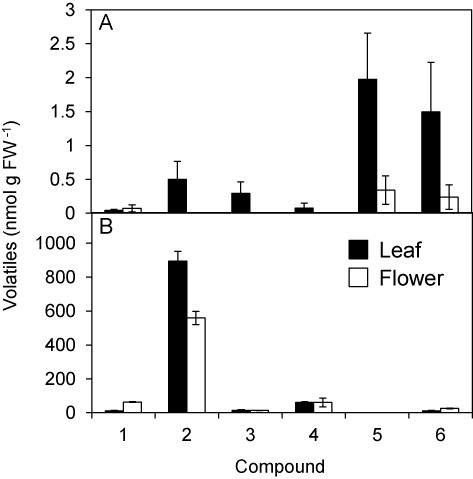
Figure 3. GLVs formed from intact and freeze-thaw–disrupted flowers and leaves. GLVs emitted from intact (A) and freeze-thaw–disrupted (B) flowers (white bars) and leaves (black bars) were collected with an SPME fiber, and quantified with gas chromatography–mass spectrometry. 1: n-hexanal, 2: (Z)-3-hexenal, 3: 1-penten-3-ol, 4: (E)-2-hexenal, 5: (Z)-3-hexen-1-yl acetate, 6: (Z)-3-hexen-1-ol. Values are given as means ± standard error.
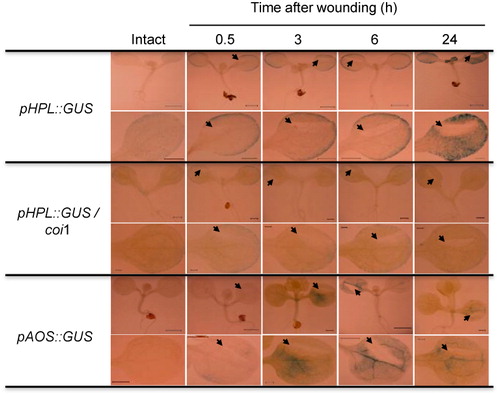
Figure 4. GUS activity in seedlings of transgenic A. thaliana plants after mechanical wounding. GUS activity derived from pAtHPL::GUS with wild-type (Col-0) and coi1 and from pAtAOS::GUS with wild-type (C24) was detected with GUS staining after pressing one side of a cotyledon once with forceps. The wounded place is shown with arrows.
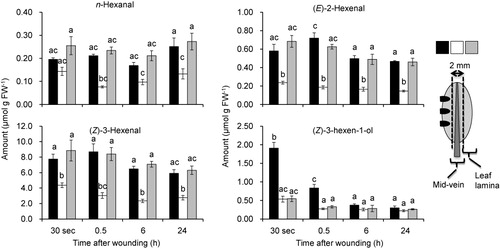
Figure 5. The ability to form GLVs in each section of the leaf after mechanical wounding. After applying a mechanical wound to leaf lamina of a 4-week-old Arabidopsis (No-0) plant with forceps, the leaf was dissected into directly injured lamina section (black bars), mid-vein section (white bars), and the other side of the lamina (grey bars) as shown with the diagram on the right. After freezing at −80°C, the sections were thawed at 25°C for 10 min. Thereafter, the volatiles formed were collected with an SPME fiber for 30 min at 25°C. Values are given as means ± standard error (n = 3). The letters indicate significant differences between the mid-vein and leaf lamina (analysis of variance, Scheffé test, P < 0.05).
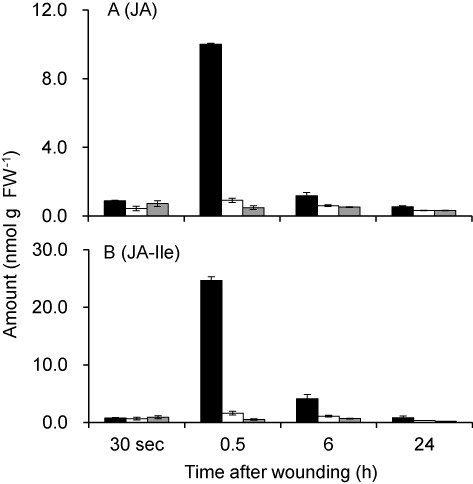
Figure 6. Amounts of JA and JA-Ile in each section of a leaf after mechanical wounding. Leaves of Arabidopsis (No-0) were wounded on one side of the leaf lamina. The leaf was then dissected into a directly injured lamina section (black bars), a mid-vein section (white bars), and the other side of the lamina (grey bars) as shown in . The amounts of JA (A) and JA-Ile (B) were determined with LC-MS/MS. Values are given as means ± standard error (n = 3).