Figures & data
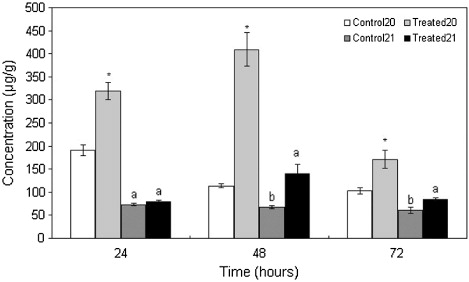
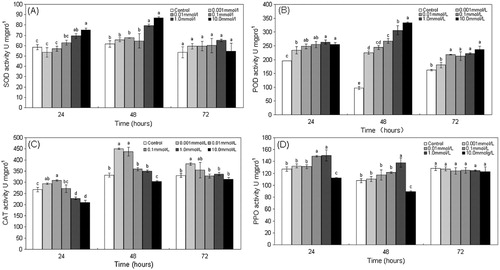
Note: All values are mean ± standard deviation of the mean (SD). Different letters indicate significant differences between the treatment and the control (P < 0.05; t test).
Notes: The bars represent hexyl formate (1), (Z)-butanoic acid-3-hexenyl ester (2), cis-3-hexenyl-2-methylbutyrate (3), 2-ethyl-1-hexanol (4), unknown (5), 2-hydroxy-benzaldehyde (6), 2,6-dimethyl-5-heptenal (7), methylsalicylate (8), methoxy-phenyl-oxime- (9), geraniol (10), phenol (11), eugenol (12), dibutylphthalate (13), (Z)-3-nonen-1-ol (14), (E)-2-hexen-1-ol (15), 1-octanol (16), (E,Z)-3,6-nonadien-1-ol (17), β-ionone (18), and hexadecanamide (19). Each compound was more than 80% matched. For each number, different small letters indicate statistically significant differences in volatile release concentrations between the treated and the control plants (GraphPad InStat version 3.00; N = 3; P < 0.05).
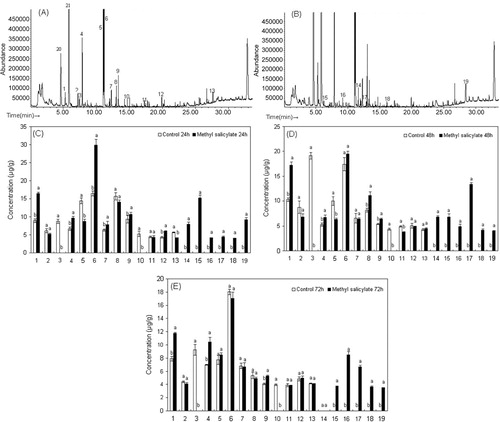
Table 1. The content changes of six volatile compounds only produced in the treated leaves (among 19 low-quantity volatile compounds) at the different time periods.
Note: Columns with an asterisk or with different small letters have significantly different volatile release concentrations between the treated and control leaves (GraphPad InStat version 3.00; N = 3; P < 0.05).