Characteristic expression of wheat PR5 gene in response to infection by the leaf rust pathogen, Puccinia triticina
Xiao-Ying LiCenter of Plant Disease and Plant Pests of Hebei Province, College of Plant Protection, Agricultural University of Hebei, Baoding071001, ChinaView further author information
,
Lin GaoCenter of Plant Disease and Plant Pests of Hebei Province, College of Plant Protection, Agricultural University of Hebei, Baoding071001, ChinaView further author information
,
Wei-Hong ZhangCenter of Plant Disease and Plant Pests of Hebei Province, College of Plant Protection, Agricultural University of Hebei, Baoding071001, ChinaView further author information
,
Jing-Kun LiuCenter of Plant Disease and Plant Pests of Hebei Province, College of Plant Protection, Agricultural University of Hebei, Baoding071001, ChinaView further author information
,
Yan-Jun ZhangCenter of Plant Disease and Plant Pests of Hebei Province, College of Plant Protection, Agricultural University of Hebei, Baoding071001, ChinaView further author information
Da-Qun LiuCenter of Plant Disease and Plant Pests of Hebei Province, College of Plant Protection, Agricultural University of Hebei, Baoding071001, ChinaView further author information
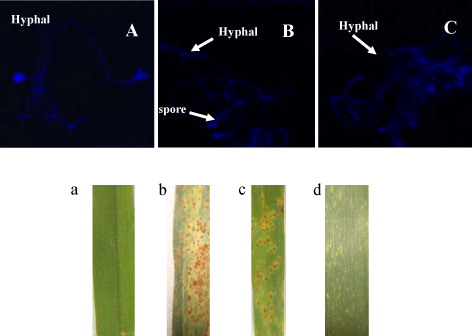
Figure 1. Histological observation and phenotypic expression of wheat leaves infected with Puccinia triticina. Higher panels: Observation of hyphal and germinating spores; A: TcLr35 at the adult stage; B: TcLr35 at the seeding stage; C: Thatcher. Lower panels: Phenotypic expression of wheat leaves showing differences in severity of leaf rust symptoms on 10 dpi at different growth period. a: TcLr35 mock inoculated; b: susceptible parent lines Thatcher pathogen inoculated; c: TcLr35 pathogen inoculated at the seeding stage; d: TcLr35 pathogen inoculated at the adult stage.
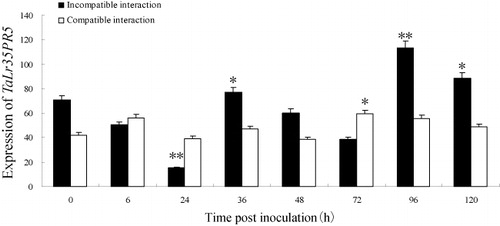
Figure 2. Expression profiles of TaLr35PR5 in incompatible and compatible interaction leaves infected by the avirulent P. triticina isolate 07-10-426-1 at different times post-inoculation. The relative expression is expressed as fold change relative to mock inoculated plants on 0 hpi. The y-axis indicates the amounts of TaLr35PR5 transcript normalized to the GAPDH gene. The x-axis indicates sampling times. Error bars represent variation among three biological replicates. *p < 0.05, n = 3.
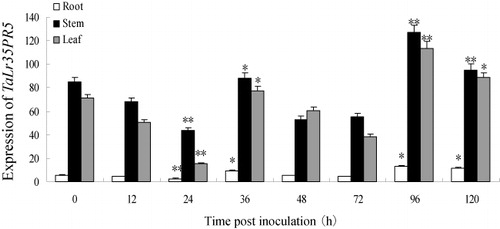
Figure 3. Expression profiles of TaLr35PR5 in different wheat tissues after inoculation with P. triticina at different time points. The relative expression is expressed as fold change relative to mock inoculated plants on 0 hpi. The y-axis indicates the amounts of wheat TaLr35PR5 transcript normalized to the GAPDH gene. The x-axis indicates different wheat tissues at different hpi. Error bars represent variation among three biological replicates. **p < 0.01, *p < 0.05, n = 3.
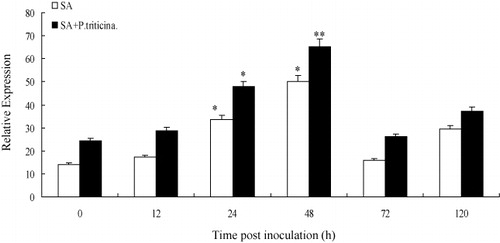
Figure 4. Expression profiles of TaLr35PR5 in wheat leaves treated by SA and pre-treated with SA chemical inducers prior to P. triticina inoculation at different time points. The y-axis indicates the amounts of TaLr35PR5 transcript normalized to the GAPDH gene and express relative to that of susceptible cultivar treated with SA. The x-axis indicates sampling times. Error bars represent variation among three biological replicates. **p < 0.01, *p < 0.05, n = 3.
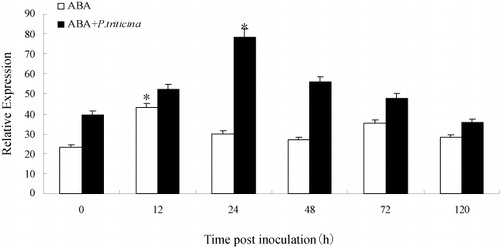
Figure 5. Expression profiles of the TaLr35PR5 gene in wheat leaves treated by ABA and pre-treated with ABA chemical inducers prior to P. triticina inoculation at different time points. The y-axis indicates the amounts of TaLr35PR5 transcript normalized to the GAPDH gene and express relative to that of susceptible cultivar treated with ABA. The x-axis indicates sampling times. Error bars represent variation among three biological replicates. **p < 0.01, *p < 0.05, n = 3.
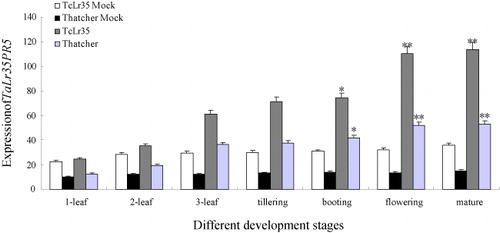
Figure 6. Expression profiles of TaLr35PR5 at different growth and development of wheat. The y-axis indicates the amounts of wheat TaLr35PR5 normalized to the GAPDH gene and express relative to mock inoculated plants on 0 hpi. The x-axis indicates the different development stage. Error bars represent variation among three biological replicates. **p < 0.01, *p < 0.05, n = 3.
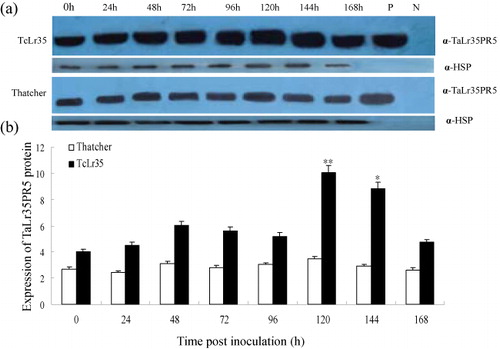
Figure 7. Accumulation of TaLr35PR5 protein in compatible (Thatcher) and incompatible (TcLr35) leaves infected by the avirulent P. triticina isolate 07-10-426-1 at different times post-inoculation. A: Western blot was probed with the TaLr35PR5 antibody. The purified TaLr35PR5 protein was used as a positive control. Plasmid pEASY was used as a negative control. Heat shock protein (HSP) was taken as the loading control. B: Plot of average and standard deviation among three repeats of WB analysis. The y-axis indicates the amount of TaLr35PR5 protein level normalized to the HSP and express relative to that of noninoculated control, and the x-axis indicates sampling times. **p < 0.01, *p < 0.05, n = 3.
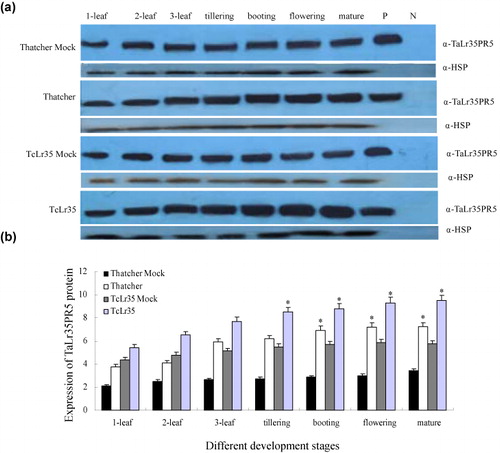
Figure 8. Expression profiles of TaLr35PR5 proteins in wheat leaves at different growth stages A: Western blot was probed with the TaLr35PR5 antibody. Lanes 1–9: Protein samples isolated from normal wheat leaves at seedling stage (1-leaf, 2-leaf, and 3-leaf stage), tillering stage, booting stage, flowering stage, mature stage, positive control, and negative control. The purified TaLr35PR5 protein was used as a positive control. Plasmid pEASY was used as a negative control. Heat shock protein (HSP) was taken as the loading control. B: Plot of average and standard deviation among three repeats of WB analysis. The y-axis indicates the amount of TaLr35PR5 protein level normalized to the HSP and express relative to that of noninoculated control, and the x-axis indicates different development stages. **p < 0.01, *p < 0.05, n = 3.