Figures & data
Figure 1. Visualization of sampling sites in which survey work was conducted during 2013. Field sites were located in Fenghuang mountain-Ya mountain regions, which belongs to the border of Tongling city and Nanling County. (a) Distribution of 30 cultural fields. (b) Map of one cultural field. (c) Plantlet of P. ostii. (d) Collected fruit of P. ostii before natural cracking. (e) Seed and natural cracking of fruit.373 x 148 mm (150 x 150 DPI)
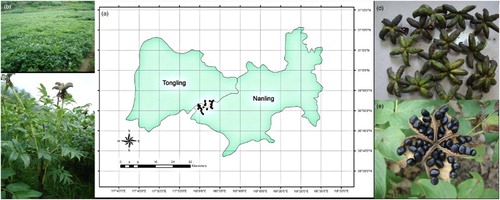
Figure 2. Gas chromatogram showing the fatty acid composition of P. ostii 343x161mm (72 x 72 DPI)
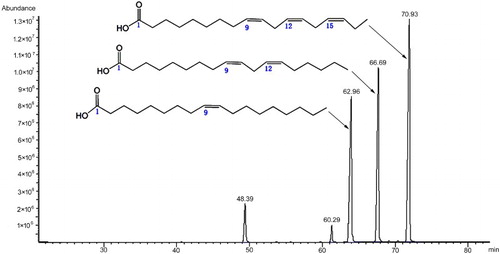
Table 1. The variation of seed traits in various field condition.
Table 2. The variation of metal element, pH, and electrical conductivity in soils in various cultural regions.
Figure 3. The influence of Cu content in soils on composition of seed oils 170 x 80mm (150 x 150 DPI)
Table 3. The Pearson correlations between Fe, Zn, and Cu content in leaves and in soils.
Figure 4. The influence of Cu content in leaves on composition of seed oils. 170 x 80mm (150 x 150 DPI)