Figures & data
Table 1. Characteristics of soil used for present study.
Table 2. Shoot/root length and fresh/dry weight of oat (A. sativa L. cultivar KENT) seedlings raised under different potassium treatments (7 DAS).
Table 3. Shoot/root length and fresh/dry weight of oat (A. sativa L. cultivar KENT) seedlings raised under different potassium treatments and PEG-induced water stress (7 DAS).
Table 4. Plant height, Number of tillers and RWC in A. sativa L. cultivar KENT supplied with different salts of potassium (55 DAS).
Table 5. Chlorophyll and Carotenoid (mg g−1 fresh wt) contents in oat (A. sativa L. cultivar KENT) seedlings raised under different potassium treatments (7 DAS).
Table 6. Chlorophyll and Carotenoid (mg g−1 fresh wt.) contents in oat (A. sativa L. cultivar KENT) seedlings raised under different potassium treatments and PEG-induced water stress (7 DAS).
Table 7. Chlorophyll a, b, Total Chlorophylls and Carotenoid (mg g−1 fr wt.) contents in flag leaf of A. sativa L. cultivar KENT supplied with different salts of potassium (55 DAS).
Figure 1. Nitrate reductase activity (µ mole NO2 produced hr−1 g−1 fr wt) in oat (A. sativa L. cultivar KENT) seedlings raised under different potassium treatments (A) and PEG (B) induced water stress (7 DAS).
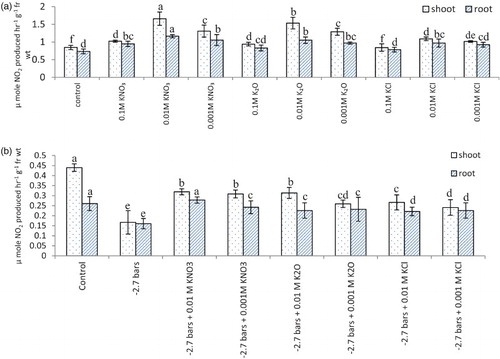
Figure 2. Nitrate reductase activity (µ mole NO2 produced hr−1 g−1 fr wt) in flag leaf of A. sativa L. cultivar KENT supplied with different salts of potassium (55 DAS).
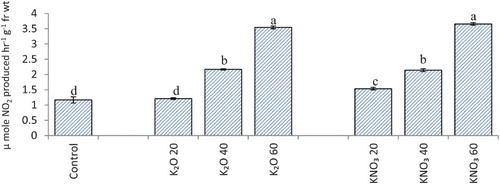
Figure 3. Alanine (A) and Aspartate (B) aminotransferase activity (µ mol keto acid released mg−1 protein min−1) in oat (A. sativa L. cultivar KENT) seedlings raised under different potassium treatments (7 DAS).
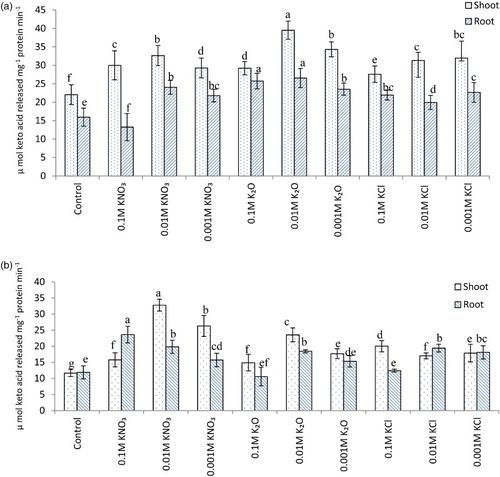
Figure 4. Alanine (A) and Aspartate (B) aminotransferase activity (µ mol keto acid released mg−1 protein min−1) in oat (A. sativa L. cultivar KENT) seedlings raised under different potassium treatments and PEG-induced water stress (7 DAS).
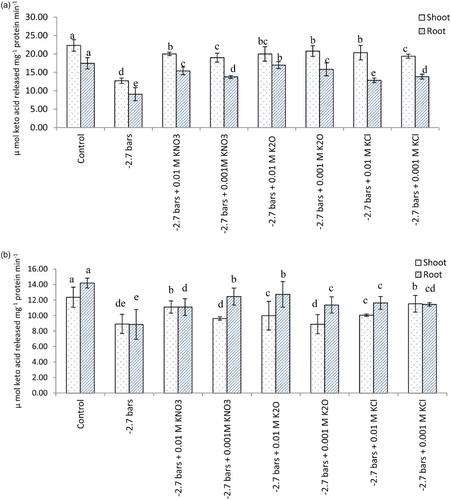
Figure 5. Alanine (A) and Aspartate Aminotransferase (B) (µ mol keto acid released mg−1 protein min−1) in flag leaf of A. sativa L. cultivar KENT supplied with different salts of potassium (55 DAS).
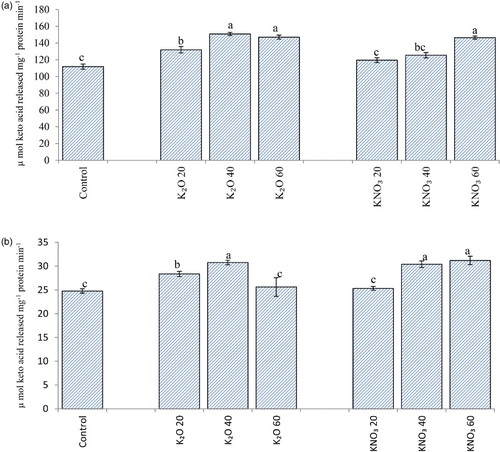
Table 8. Phenols and Tannins (mg g−1 dry wt.) contents in A. sativa L. cultivar KENT supplied with different salts of potassium (55 DAS).
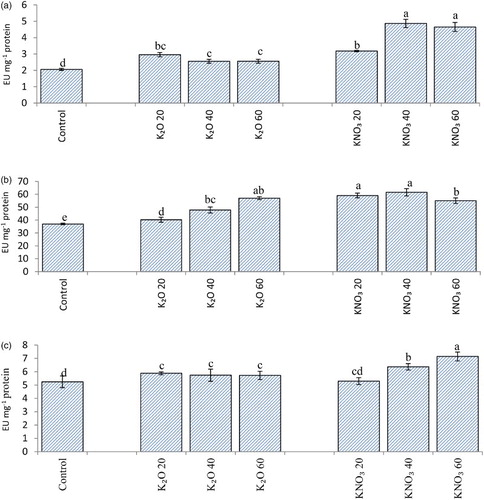
Figure 6. Superoxide dismutase (A), Catalase (B) and Ascorbate peroxidase (C) (EU mg−1 protein) activity in flag leaf of A. sativa L. cultivar KENT supplied with different salts of potassium (55 DAS).