Figures & data
Figure 1. Scheme for cloning of CMV-CP gene in binary vector pBI 121 for stable transformation of tobacco (Nicotianatabacum).
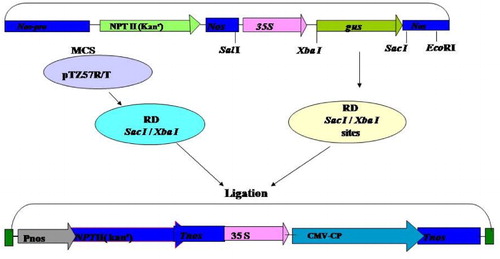
Figure 2. Confirmation of construct pBI CMV-CP. (a) Restriction digestion of recombinant vector plasmid by XbaI and Sac I, showing plasmid pBI 121 and CMV-CP gene, Lane M, λ DNA Eco RI–Hind III marker. (b) PCR of recombinant vector plasmid with CMV-CP specific primer. (c) Southern hybridization of same PCR gel probed with α-P32 labeled cloned CP gene of CMV.
Figure 3. Analysis of T0 generation transformants for CMV-CP gene. (a) Confirmation by PCR of 10 transformed lines, (b) Confirmation by Southern blot of transformed lines, (c) Western blot of transformed lines.
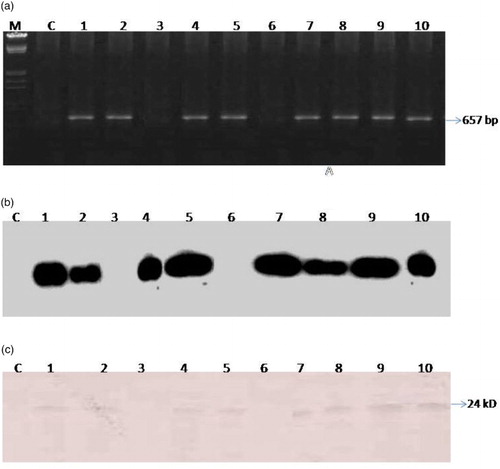
Figure 4. Confirmation of CMV-CP in T1 generation. (above) PCR, (below) Southern blot.
Table 1. Percentage of A, D, E and H progenies (T1 generation) showing full resistance or delayed symptoms or susceptibility to CM-Gladiolus infection at 25 days post inoculation.
Figure 5. Analysis of expression level of coat protein in transformed lines A, D, E and H.
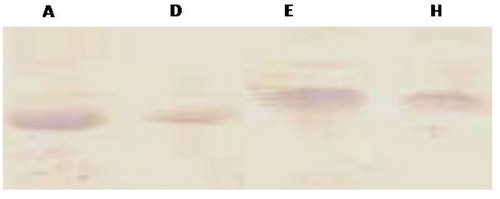
Table 2. Cucumber mosaic virus challenge inoculation from different host reported from subgroup IB to transgenic lines expressed IA coat protein gene.
Figure 6. Western blot of transgenic line showing reduced level of virus accumulation in their systemic leaves (b) as compared to their inoculated leaf (a) at 25 dpi.