Figures & data
Table 1. Dry weight of roots and shoots. Each value represents the mean ± S.E. (n = 3, being each sample from a different pot). For a 95% confidence level, letters a, b, c and r, s indicate significant differences among treatments within each experimental period and among different experimental periods times for each treatment, respectively.
Table 2. Micronutrients of roots and shoots. Each value represents the mean ± S.E. (n = 3, being each sample from a different pot). For a 95% confidence level, letters a, b, c, d and r, s, t, u indicate significant differences between treatments within each experimental period and between different experimental periods times for each treatment, respectively.
Table 3. Macronutrients of roots and shoots. Each value represents the mean ± S.E. (n = 3, being each sample from a different pot). For a 95% confidence level, letters a, b, c and r, s, t indicate significant differences between treatments with in each experimental period and between different experimental periods times for each treatment, respectively.
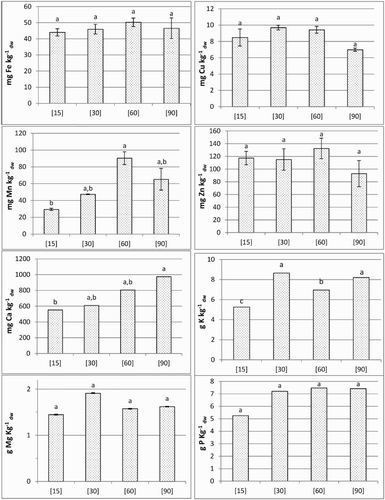
Figure 1. Nutrients contents in the grains. Each value represent the mean ± S.E. (n = 2). For a 95% confidence level, letters a, b indicate significant differences between treatments.

Table 4. Total accumulation of micronutrients in roots, shoots and grains. In each experimental period, values were determined multiplying the average of each micronutrient and total biomass of each organ.
Table 5. Total accumulation of macronutrients in roots, shoots and grains. In each experimental period, values were determined multiplying the average of each micronutrient and total biomass of each organ.
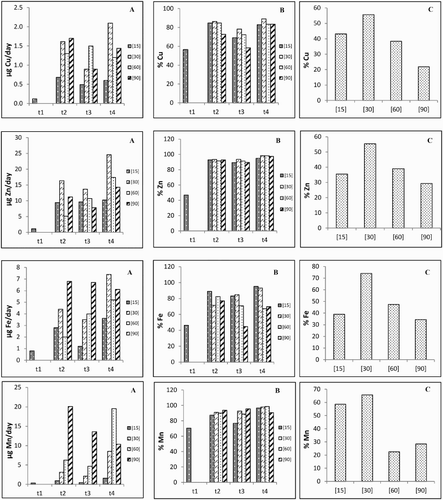
Figure 2. Roots uptake (A) and shoot translocation (B) rates as well as mobilization (C) rate to the grains of micronutrients in each experimental period and for the different treatments.


![Figure 4. Location of nutrients in wheat grains halved by fluorescence radiation of X rays. For treatments [15] and [90], respectively: scanning electron micrographs (1 and 1a); Fe (2 and 2a); Zn (3 and 3a); Mn (4 and 4a); Cu (5 and 5a); K (6 and 6a); P (7 and 7a); Ca (8 and 8a).](/cms/asset/8b07d141-e790-49b7-9064-a01619a93ae0/tjpi_a_1278049_f0004_c.jpg)