Figures & data
Scheme 1. Synthesis of N-trans-cinnamoyltyramine (1) from trans-cinnamic acid (2) and tyramine (3).
Table 1. The 13C NMR spectroscopic data for the natural N-trans-cinnamoyltyramine and the synthesized N-trans-cinnamoyltyramine.
Scheme 2. Proposed biosynthesis pathway of N-trans-cinnamoyltyramine.
Figure 1. N-trans-cinnamoyltyramine.
Figure 2. Analogs of N-trans-cinnamoyltyramine.
Figure 3. Effects of N-trans-cinnamoyltyramine on hypocotyl (shoot) and root growth of cress seedlings. ED50 values represent the effective dose to reduce the representative parameter (shoot or root growth) by 50%. Means followed by the same letter are not significantly different using Duncan’s multiple range test at P ≤ .001).
Figure 4. Effects of N-trans-cinnamoyltyramine on hypocotyl (shoot) and root growth of barnyardgrass seedlings. ED50 values represent the effective dose to reduce the representative parameter (shoot or root growth) by 50%. Means followed by the same letter are not significantly different using Duncan’s multiple range test at P ≤ .001.
Figure 5. ED50 values of N-trans-cinnamoyltyramine on shoot and root growth of cress and barnyardgrass seedlings (results of repeated studies using four replications). Vertical bars indicate the standard error of the means. Means followed by the same letter are not significantly different using Duncan’s multiple range test at P ≤ .001.
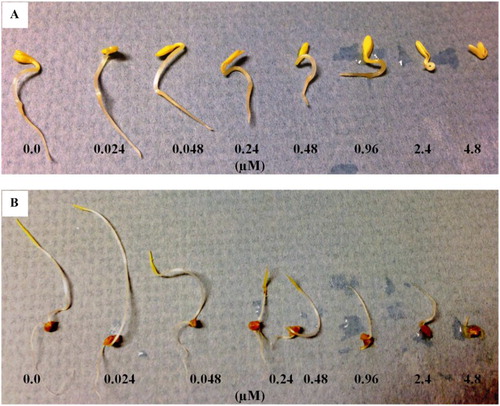
Figure 6. Effects of N-trans-cinnamoyltyramine on hypocotyl and root growth of cress (A) and barnyardgrass (B) seedlings following 48 hours of incubation at various concentrations.