Figures & data
Table 1 . Primer sequences used for RT-qPCR in this study.
Table 2 . Effects of PEN on pigment contents of C. tinctorious L. under different NaCl concentrations.
Figure 1. Effects of salinity (0, 100, 200 mM NaCl) and PEN on content of a flavonoid and b anthocyanin in safflower plants at 21 days after the start of treatments. The groups are –PEN (plants with no penconazole treatment) and +PEN (plants sprayed with 15 mgl–1 penconazole once a week). Columns indicate mean ± SE. Means with different letters indicate a significant difference at P ≤ .05 using Duncan multiple range test.
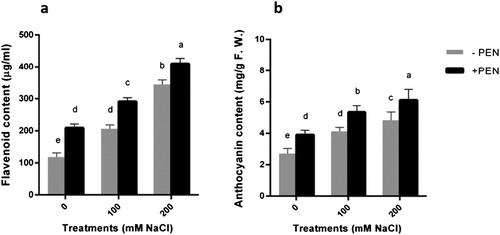
Figure 2. Effects of salinity (0, 100, 200 mM NaCl) and PEN on content of a carbohydrate and b protein contents in safflower plants at 21 days after the start of treatments. The groups are – PEN (plants with no penconazole treatment) and +PEN (plants sprayed with 15 mgl–1 penconazole once a week). Columns indicate mean ± SE. Means with different letters indicate a significant difference at P ≤ .05 using Duncan multiple range test.
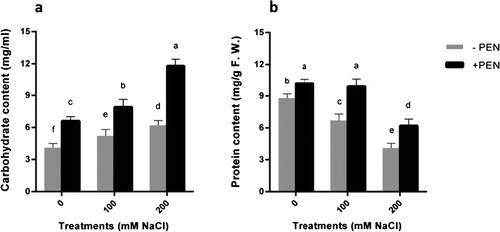
Figure 3. Loading plots of principal components 1 and 2 of the PCA. Results obtained from biochemical data of safflower plants subjected to salinity and exogenous PEN.
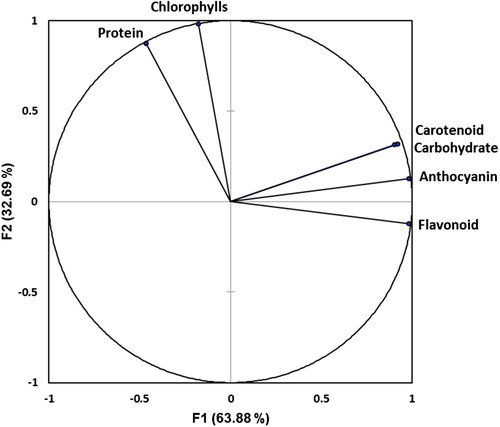
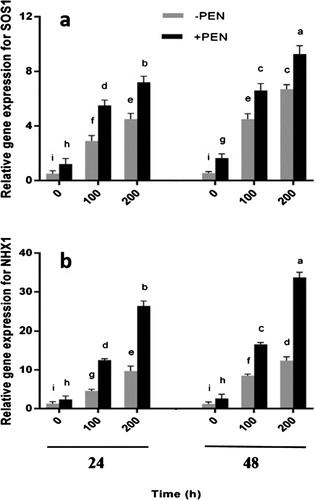
Figure 4. RT-qPCR analyses of a SOS1 and b NHX1 genes transcript of safflower plants treated with salinity and PEN after 24 and 48 hours. Salinity levels were 0, 100 and 200 mM NaCl. The groups are –PEN (plants with no PEN treatment) and +PEN (plants sprayed with 15 mg/l PEN once a week). B-Actin was used as an endogenous control to normalize the data for input RNA difference between the various samples. Columns indicate mean ± SE. Means with different letters indicate a significant difference at P ≤ .05.