Figures & data
Table 1. Gene specific primers for quantitative RT-PCR.
Figure 1. Choice test of whitefly on ToMV-inoculated and mock-treated healthy plants. A, Experimental system of choice test. Each potted plant was placed at the two corners of the acrylic box (gray circles). Whiteflies set at equidistant from the two plants (dotted circle). B, Preference of whiteflies for ToMV-inoculated (gray box) and mock-treated plants (white box). Box plot explanation: upper horizontal line of box, 75th percentile; lower horizontal line of box, 25th percentile; horizontal bar within box, median; upper and lower lines outside the boxes, minimum and maximum values (error bars). Experiments were repeated independently (n = 12). Asterisk indicates that the data compared were significantly different (P < 0.05, Wilcoxon signed-rank test).
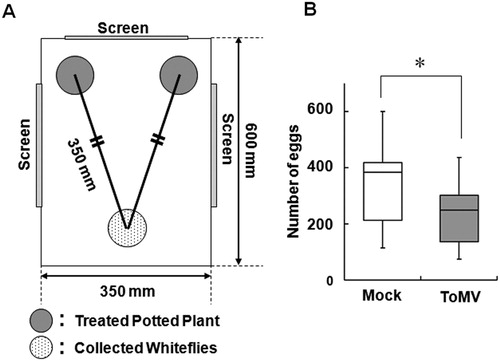
Figure 2. Performance of whiteflies on ToMV-inoculated or mock-treated plants. A, Hatching rate of whiteflies on the systemically infected leaf of ToMV-inoculated and mock-treated plants. Open circle with solid line indicates the hatching rate on the leaf of mock-treated plant. Closed square with dash line indicates the hatching rate on the leaf of ToMV-infected plants. The same experiments were repeated twice and the average values are indicated. The total number of eggs was 239 on ToMV-infected leaves and 181 on mock-treated leaves. Different letters indicate that the data compared were statistically significantly different (P < 0.05, log-rank test). B, The emergence rate of whiteflies on ToMV-inoculated (black) and mock-treated plants (white). Bar graph indicates the mean ± standard error of the mean of repeated experiments on mock-treated plant (n = 5) and on ToMV-inoculated plant (n = 6). Asterisk indicates that the data compared were statistically significantly different (P < 0.05, t-test).
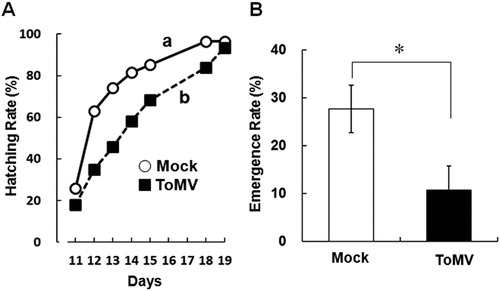
Figure 3. Molecular response of Micro-Tom against ToMV infection. A, Expression profile of the typical stress-inducible genes in the systemic leaf after ToMV inoculation. The total RNA was extracted 7 days after ToMV inoculation and mRNA of PIN2, PR4 and SOD genes was quantified by the qRT-PCR. B, Accumulation of SA, total SA (SA + SAG), and JA in the systemic leaf after ToMV inoculation. White indicates mock treatment and black indicates ToMV infection. Each bar indicates the mean ± standard error of the mean of repeated experiments (A: n = 3; B: n = 4). Asterisk indicates that the data compared were statistically significantly different (P < 0.05, t-test). NS indicates no significance.
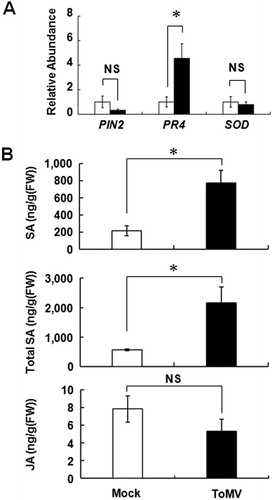
Figure 4. Effect of SA on the preference of whitefly for tomato plants. A, Whitefly preference for SA-treated and SDW-treated plants. Wild type Micro-Tom plant was sprayed with 1 mM SA or SDW, and 2 days after each treatment, the plants were set in acryl box (A) and used in the choice test. The number of eggs laid on each plant was counted at 7 days after inoculation. B, Preference of whiteflies for mock-treated and ToMV-infected NahG plant. NahG tomato plants were ToMV inoculated or mock treated, and the preference of whitefly was assessed at 7 days after each treatment. C, Preference of whiteflies for intact NahG and control plants. Box plot explanation: Upper horizontal line of box, 75th percentile; lower horizontal line of box, 25th percentile; horizontal bar within box, median; upper and lower lines outside the boxes, minimum and maximum values (error bars). Each test was repeated independently (A: n = 6; B: n = 6; C: n = 8). Asterisk indicates that the data compared were significantly different (P < 0.05, Wilcoxon signed-rank test). NS indicates no significance.
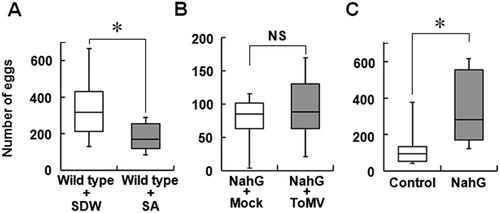
Figure 5. Micro-Tom response to whitefly infection. A, Expression pattern of the typical stress-inducible genes in wild type Micro-Tom after infestation with five whiteflies. The total RNA was extracted 3 days after infestation with whiteflies. White indicates intact plant and black indicates whitefly-infected plant. B, Accumulation of SA, total SA, and JA in control plant (transformed with empty vector) after the infestation with whiteflies. White indicates intact plant and black indicates whitefly-infested plant. Each bar represents the mean ± standard error of the mean of repeated experiments (A: n = 5; B: n = 4). Asterisk indicates that the data compared were statistically significantly different (P < 0.05, t-test). NS indicates no significance.
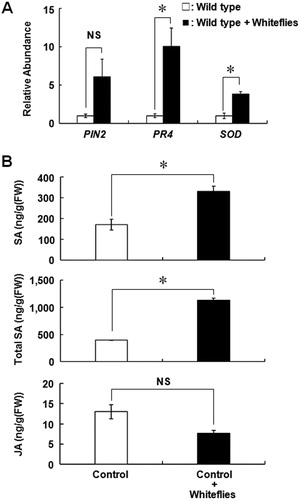
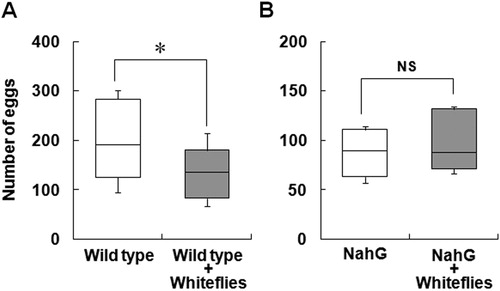
Figure 6. Effect of inoculation of tomato plants with whitefly on the preference of whitefly. The preference of whitefly for infested and uninfested plants using wild type tomato (A) and NahG transgenic tomato (B). Tomato plants were locally infested with five whiteflies using a small cage and uninfested with empty cage treatment for 3 days. After treatment, each plant was set in acrylic box (A), and 25 whiteflies were released in the box. Numbers of eggs laid were counted after 7 days. Box plot explanation: upper horizontal line of box, 75th percentile; lower horizontal line of box, 25th percentile; horizontal bar within box, median; upper and lower lines outside the boxes, minimum and maximum values (error bars). Each test was repeated independently (A: n = 8; B: n = 6). Asterisk indicates that the data compared were significantly different (P < 0.05, Wilcoxon signed-rank test). NS indicates no significance.