Figures & data
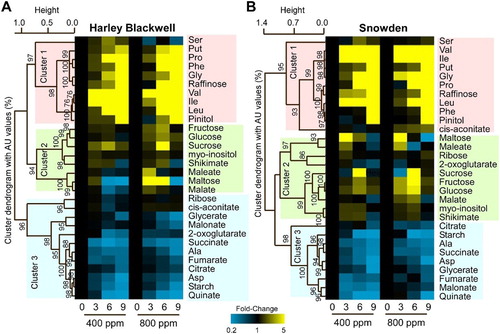
Figure 1. Effects of CO2 enrichment, genotype, and water stress on changes of potato LWP. Changes of leaf water potential (LWP) in two potato cultivars, Harley Blackwell (HB) and Snowden (SD), when plants were subjected to progressive drought at 0, 3, 6 and 9 days (d) after water was withheld at ambient (400 ppm) and elevated (800) CO2 levels. Control: well-watered condition; Drought: water deficit condition. Error bars represent SEM (n = 6). The ANOVA for the treatments and duration of drought (days) are also given as *; P < 0.05; **; P < 0.01.
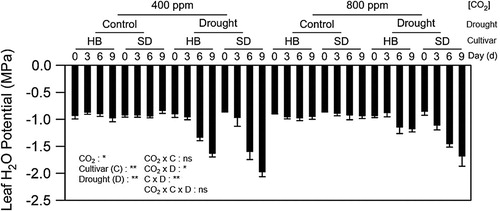
Figure 2. Diagram of foliar metabolic changes due to water stress and CO2 enrichment in Harley Blackwell. The x-axis shows days of drought treatment. The y-axis shows leaf metabolite concentrations. The open and closed circle represents well-watered (C) and drought (D) condition. The grey and black color represents ambient (400 ppm) and elevated (800 ppm) CO2 levels. Error bars represent SEM (n = 8). Abbreviations are for carbohydrates, CB (Suc, sucrose; Raff, raffinose; Mal, maltose; Pin, pinitol; Rib, ribose; Fru, fructose; Glc, glucose; myo-ino, myo-inositol; Stch, leaf starch), amino acids, AA (Gly, glycine; Ser, serine; Leu, leucine; Phe, phenylalanine; Val, valine; Ala, alanine; Asp, aspartate; Ile, isoleucine; Pro, proline; Phe, phenylalanine), and organic acids, OA (Mala, malate; Fum, fumarate; Succ, succinate; Cit, citrate; cis-acon, cis-aconitate; Oxo, 2-oxoglutaric acid; Quin, quinate; Malo, malonate; Male, maleate; Glyc, glycerate; Shik, Shikimate). Put, Putrescine
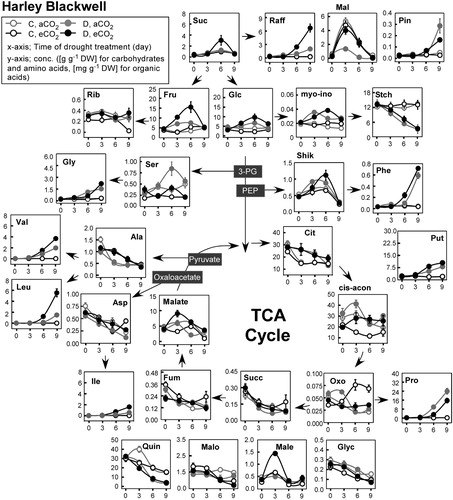
Figure 3. Diagram of foliar metabolic changes due to water stress and CO2 enrichment in Snowden. Other details are as in .
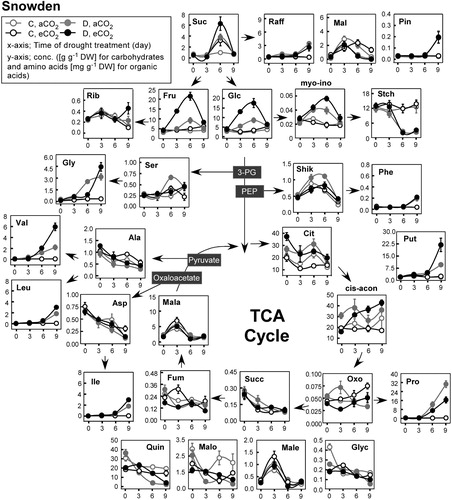
Table 1. Analysis of variance (ANOVA) results for leaf water potential and metabolites. Treatment effects of CO2, drought (D), and cultivar (C) and their interactions on the leaf water potential and responses of leaf metabolites.
Figure 4. One-way Hierarchical clustering analysis of metabolites in two potato cultivars, Harley Blackwell (HB) and Snowden (SD) across drought and CO2 treatments. Heatmap with hierarchical clustering analysis showing either the increase (shown in yellow) or decrease (shown in blue) of leaf metabolites in response to time of drought treatment (0, 3, 6, and 9 days), and CO2 treatments (ambient, 400 ppm vs. elevated, 800 ppm) in the HB (A) and SD (B). Values are given as ratios obtained from drought and well-watered (control) treatments and are shown in gradations from 0.2–5× (see scale bar). Ratios that were unchanged are shown in black. AU represent approximately unbiased P-values (0–100%, the higher the number the more significant).