Figures & data
Table 1. Root length, root dry weight, shoot height, shoot dry weight, level of photosynthetic pigment (chl a and chl b) in leaves and water retention rate of root and shoot of Oryza sativa seedlings. Means (±SD) were calculated from four replications (n = 4) for each treatment. Values with different letters are significantly different at ≤ .05 applying test.
Figure 1. Chromium and iron concentration in the roots and shoots and their translocation rate (%) from root to shoot of 7 days old rice plants grown under different growth conditions of Cr and Ca+. Different letters in each column indicates significant differences between means ± SD of treatments (n = 4) at a p < .05 significance level.
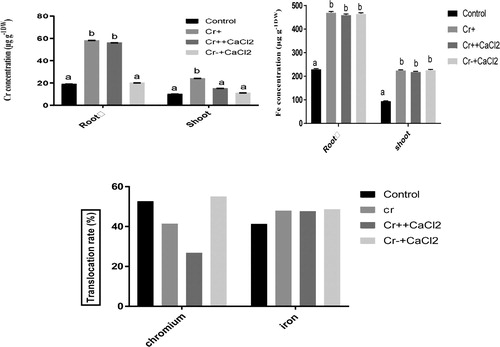
Figure 2. Total soluble protein content and electrolytic leakage in the roots of 7 d old rice plants grown under different growth conditions of chromium and calcium. Different letters in each column indicate significant differences between means ± SD of treatments (n = 4) at p < .05 significance level.
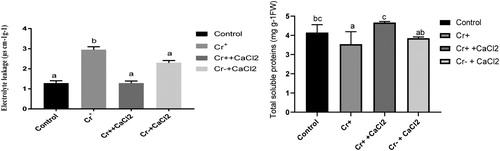
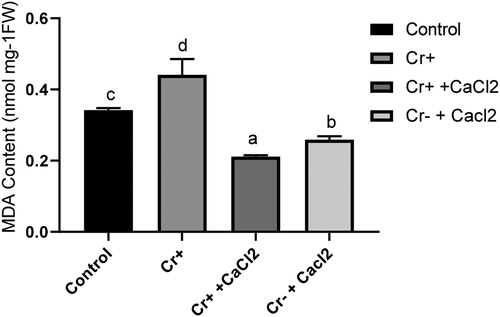
Figure 3. Malondialdehyde content in the roots of 7-day-old rice plants grown under treatment with or without chromium and calcium. Different letters in each column indicate significant differences between means ± SD of treatments (n = 4) at p < .05 significance level.