Figures & data
Table 1. Primer sequences used for RT-qPCR in this study.
Table 2. Effects of NaCl (0, 100, 200 mM) and salicylic acid on ions content at 21 days after the start of treatments in safflower.
Figure 1. RT-qPCR analyses of A SOS1 and B NHX1 genes transcript of safflower plants treated with salinity and SA after 24 and 48 h. The groups are −SA (plants with no SA treatment) and +SA (plants sprayed with 1 mM SA every other day). B-Actin was used as an endogenous control to normalize the data for input RNA difference between the various samples. Columns indicate mean ± SE.
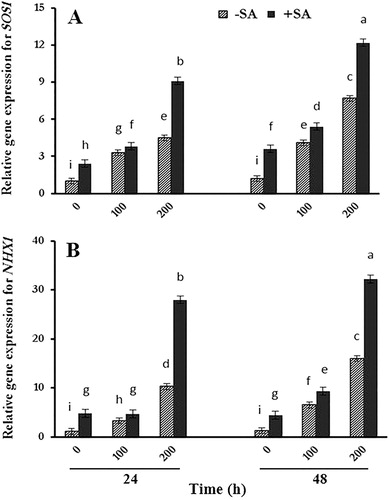
Figure 2. Effects of salinity and exogenous SA on content of auxin (IAA) and gibberellic acid (GA) in safflower plants at 21 days after the start of treatments. The groups are −SA (plants with no SA treatment) and +SA (plants sprayed with 1 mM SA every other day). Columns indicate mean ± SE.
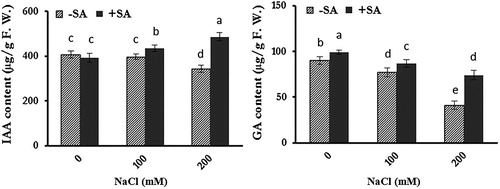
Table 3. Effects of NaCl (0, 100, 200 mM) and salicylic acid on fatty acids content at 21 days after the start of treatments in safflower.
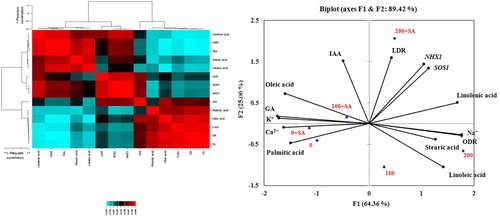
Figure 3. Loading plots of principal components 1 and 2 of the PCA (right) and hierarchical cluster analysis (left). Results obtained from the biochemical and molecular data of safflower subjected to salinity and SA.