Figures & data
Figure 1. Simplified schematic diagram on geraniol degradation pathway.
Note: Thick gray lines represent the boundary of different pathway. Geraniol degradation pathway begins with the biosynthesis of geranyl-pyrophosphate (GPP) catalysed by geraniol synthase. It was then followed by a two-step oxidation reaction which oxidizes geraniol into geranial and geranial into geranic acid via GeDH and geranial dehydrogenase respectively. Subsequently, geranic acid is activated to the corresponding CoA ester trans-geranyl-CoA, which serves as a convergence point for both geraniol and citronellol pathway. Although geraniol was generally considered to be the major precursor for geraniol degradation pathway, nerol has also been found to act as the alternative precursor for geranial production through oxidation and isomerization process (Zhang et al. Citation2013).
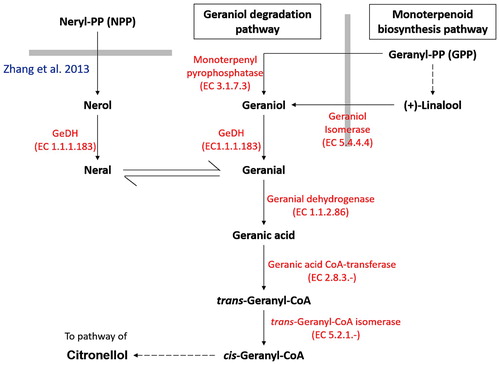
Figure 2. The phylogenetic tree was constructed with the PmNeDH and other protein sequences that belong to the MDR superfamily by Neighbour-Joining method.
Note: The accession number of each sequence is shown in bracket. The scale of the distance is indicated. The values at the nodes represent the percentage of bootstrap confidence level using 1000 random bootstrap replicates. The tree is separated into three protein macrofamilies and one outgroup, SDR, by solid bars or main cluster of protein families by square dot bars.
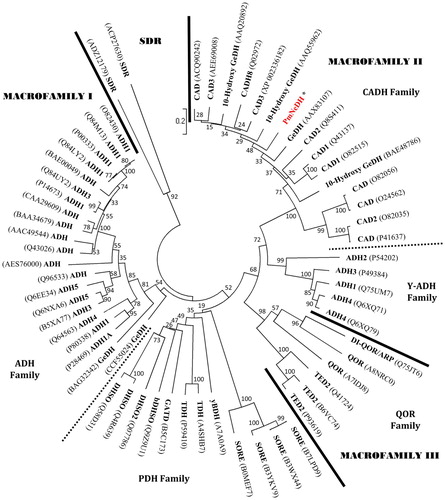
Table 1. Cis-acting elements related to stresses and stress-related phytohormones predicted on positive strand promoter of PmNeDH gene.
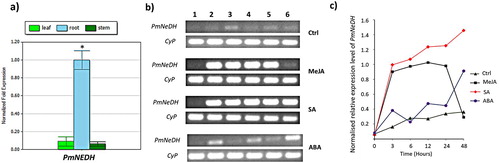
Figure 3. The relative expression level of PmNeDH gene. (a) Expression analysis of PmNeDH in different tissues of P. minor via qRT-PCR. P. minor plants used in this experiment were obtained from experimental field (3°16′14.63″”N, 101°41′11.32″”E). The transcript levels of PmNeDH are presented relative to the amount of β-actin and Tubulin. The data are shown as the mean ± SE (n = 3), in arbitrary units. *, P < 0.05 represents the significant difference as analyzed by Tukey’s test. (b) The RT-PCR products for the PmNeDH and the housekeeping gene CyP on 1.5% of agarose gel. The period of treatment was numbered on top, where 1: 0 h; 2: 3 h; 3: 6 h; 4:12 h; 5: 24 h; 6: 48 h. (c) Semi-quantitative analysis of PmNeDH gene expression after the treatment of phytohormones.