Figures & data
Figure 1. Effects of root-applied MT on the total chlorophyll content (A), Chl a (B), Chl b (C), and Chl a/b (D) at seven days NaCl treatment in tomato leaves. Means ± SE of three replicates are presented. Different letters above the columns indicate significant differences at p < 0.05 between different treatments.
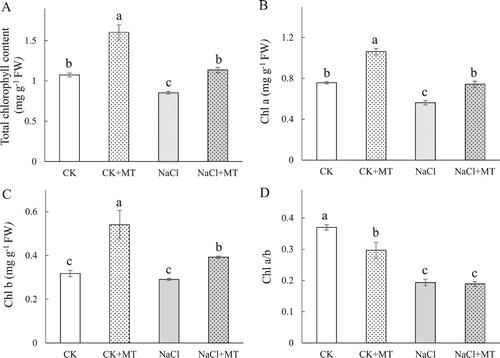
Table 1. Effects of melatonin on Pn, Gs, Ci, and CE in tomato under seven days’ salt stress.
Figure 2. Effects of MT on antioxidant systems in tomato leaves. (A) generation rate and H2O2 content in leaves; (B) Malondialdehyde (MDA) content and relative electrolyte leakage (REL); (C) Superoxide dismutase (SOD) and peroxidase (POD) activities; (D) Catalase (CAT) and ascorbate peroxidase (APX) activities in leaves; (E) Monodehydroascorbate reductase (MDHAR) and dehydroascorbate reductase (DHAR) activities; (F) Glutathione peroxidase (GPX) and glutathione reductase (GR) activities. The values were determined after plants were treated with 150 mM NaCl for three days, and were presented as means ± standard deviation (n ≥ 3). The asterisks indicate significant differences (*P < 0.05; **P < 0.01).
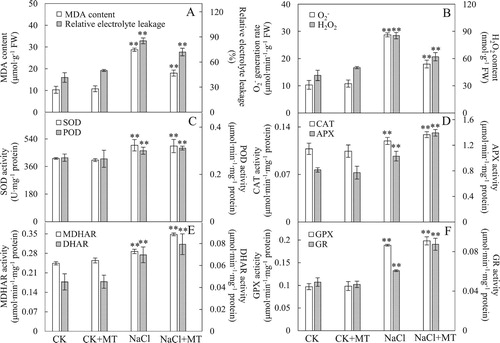
Figure 3. Effects of MT on the chlorophyll fluorescence (fluo) OJIP curves of tomato leaves treated with 150 mM NaCl. (a) OJIP transient; (b) normalized OJIP transient, the inserted column chart present the relative fluorescence intensity of step J (VJ); (c) ΔVt was obtained by subtracting the kinetics of untreated leaves from the kinetics of leaves treated with melatonin or salt between O and P; (d) normalized transient between O and J, the column chart presents the relative fluorescence intensity of step K (VK); (e) ΔVt was obtained by subtracting the kinetics of untreated leaves from the kinetics of leaves treated with melatonin or salt between O and J. O indicates the O step at about 20 ms; J indicates the J step at about 2 ms; I indicates the I step at about 30 ms; P indicates the P step, the maximum fluorescence. Each datum is the average of 6 independent measurements.
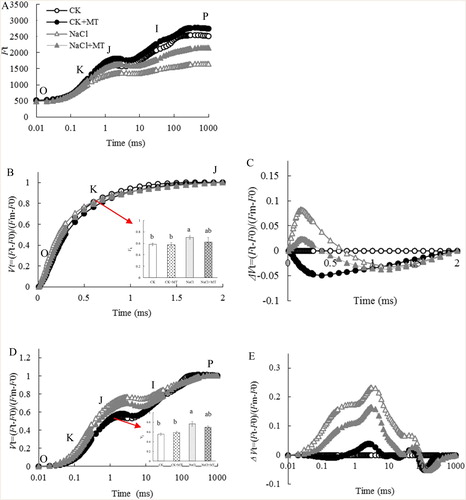
Figure 4 . Effects of MT on light energy absorption and utilization parameters under salt stress in tomato. The values were determined after plants were treated with 150 mM NaCl for three days, and were presented as means ± standard deviation (n ≥ 3).
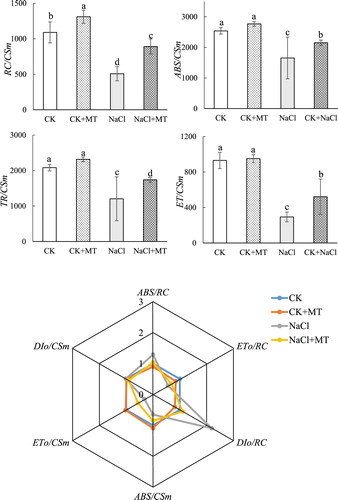
Figure 5. Quantitative image analysis of core protein levels at seven days’ salt stress in tomato leaves. D1(A) and PsbO (B) protein levels were evaluated. Total proteins were analyzed using antibodies raised against D1 and PsbO. Immunoblotting of actin (45 kDa) served as loading controls. CK, control; CK+MT, 150 μM melatonin; NaCl, 150 mM NaCl stress; NaCl+MT, 150 μM melatonin with 150 mM NaCl.
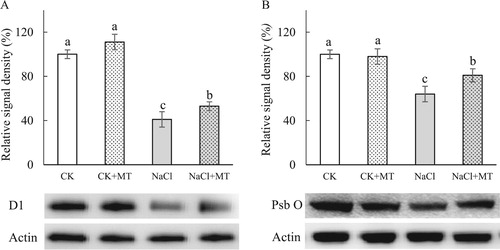
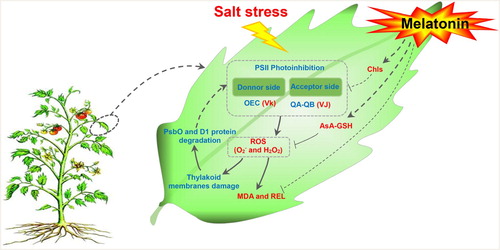
Figure 6. Schematic presentation of MT regulation systematic in tomato leaves under salt stress. Salt stress photoinhibition in the donor and acceptor sides of the photosystems II, and lead to ROS burst, which resulting in the damage to cell membrane and thylakoid membranes. To alleviate ROS toxicity, specific ROS scavenging pathways (e.g. APX, MDHAR, DHAR, and GR pathways) are induced. Exogenous MT increase the salt tolerance in tomato seedling leaves by reducing chlorophyll degradation to adjust photosynthetic electro flux and by enhancing the AsA-GSH cycle to increase the ROS scavenging capacity so as to suppress the damage caused by salt stress. Solid line with arrow and ‘T’ shape line represents stimulation and inhibition, respectively. The red and blue words indicate induced and reduced cellular processes by salt stress/MT, respectively. Dashed lines indicate indirect regulations. Abbreviations: AsA-GSH, ascorbate–glutathione cycle; Chls, chlorophyll; H2O2, hydrogen peroxide; MDA, malondialdehyde; , superoxide anion; REL, relative electrolyte leakage; ROS, reactive oxygen species; VJ, the relative variable fluorescence at the J step; Vk, the normalized relative variable fluorescence at the K step.