Figures & data
Table 1. Changes in growth parameters of tomato plants under influence of salinity and BMA12.
Figure 1. Effect of Bacillus megaterium strain A12 (BMA12) and salinity stress on chlorophyll and carotenoids contents of tomato plants. Results provided here are mean values of two independent experiments. Vertical bard represents standard error. Small letters represent level of significance among different treatments as governed by ANOVA and DNMRT at = p ≥ 0.05.
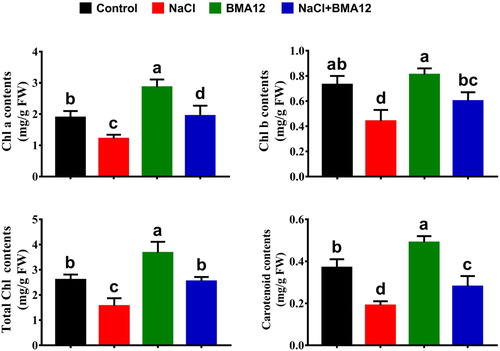
Table 2. Change in the photosynthetic parameters of tomato plants under influence of salinity and BMA12.
Table 3. Changes in activities of antioxidant enzymes in leaves of tomato plants under influence of salinity and BMA12.
Table 4. Changes in reduced and oxidized ascorbate and glutathione contents in the leaves of tomato plants under influence of salinity and BMA12.
Figure 2. Effect of Bacillus megaterium strain A12 (BMA12) and salinity stress on phytohormones profile of tomato plants. Results provided here are mean values of two independent experiments. Vertical bard represents standard error. Small letters represent level of significance among different treatments as governed by ANOVA and DNMRT at = p ≥ 0.05.
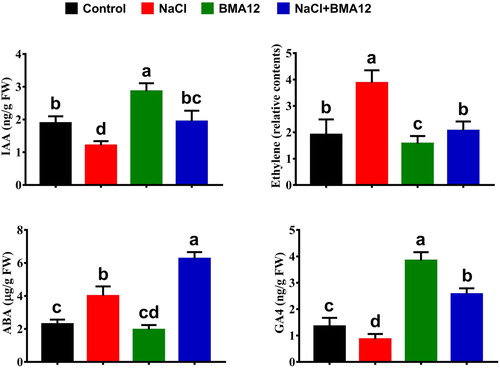
Figure 3. Effect of Bacillus megaterium strain A12 (BMA12) and salinity stress on expression of some photosynthesis and redox homeostasis related genes of tomato plants. Gene expression was analyzed one week after treatments applications. Results provided here are mean values of two independent experiments. Vertical bard represents standard error. * represents level of significance among different treatments as governed by ANOVA. (* = p ≥ 0.05, ** = p ≥ 0.01).
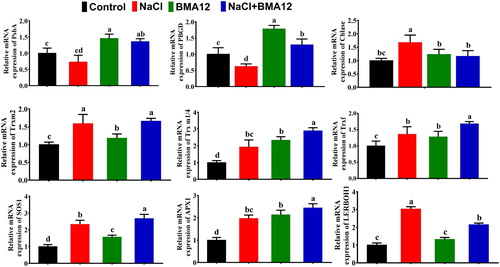
Table 5. Changes in soluble sugar contents, soluble protein contents, free amino acid contents and some stress related metabolites in tomato plants under influence of salinity and BMA12.
Figure 4. Changes in metabolomics of tomato plants induced by Effect of Bacillus megaterium strain A12 (BMA12) and salinity stress. Metabolites were quantified by UPLC/ESI MS/MS after one week after treatments applications. Metabolites were extracted from leaf samples of tomato plants. Results provided here are mean values of two independent experiments.
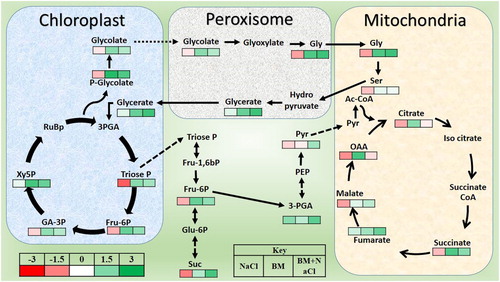
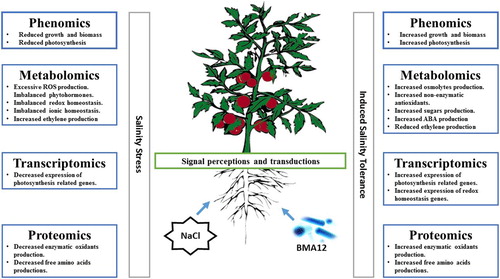
Figure 5. Possible mechanisms of induced salinity tolerance in tomato plants mediated by Bacillus megaterium strain A12 (BMA12).