Figures & data
Figure 1. Top view of the schematic diagram showing open flow and shaded flow treatments with two static (open vs shaded) treatments.
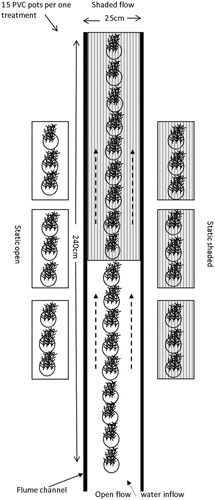
Figure 2. Rapid light curves of Ceratophyllum demersum under the four habitat conditions. The data presented are the means of four replicates, and the vertical bars denote the standard deviation.
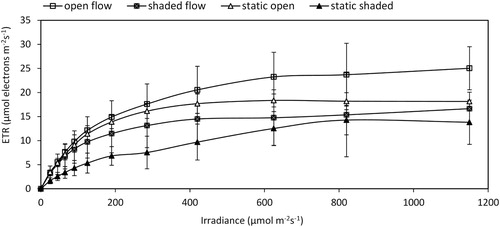
Table 1. Two-way ANOVA results showing the effects of irradiance and water flow on the physiological conditions of Ceratophyllum demersum at noon (12:00 pm). ANOVA results were significant at P < 0.05. For all response variables, DF = 1 for water flow, DF = 1 for irradiance, and DF = 1 for water flow × irradiance
Figure 3. Pigment (Chl a, Chl b and carotenoid) concentrations in Ceratophyllum demersum plants grown under the four growth conditions. The data presented are the means of three replicates, and the different lower case letters at each time point indicate significant differences between treatments.
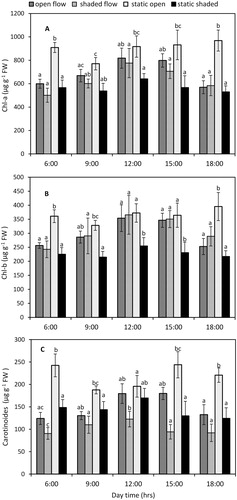
Figure 4. Hourly concentration of H2O2 (A) and activities of POD (B), APX (C), and CAT (D) in Ceratophyllum demersum plants grown under the four growth conditions. The data presented are the means of three replicates, and the vertical bars denote the standard deviation.
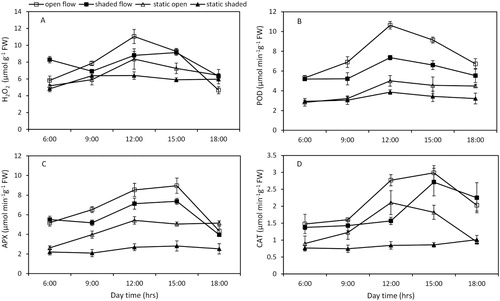
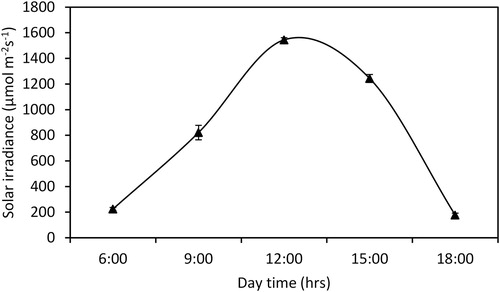
Figure 5. Diurnal variation in irradiance over a 12-hour period. The data presented are the means of three replicates, and the vertical bars denote the standard deviation.