Figures & data
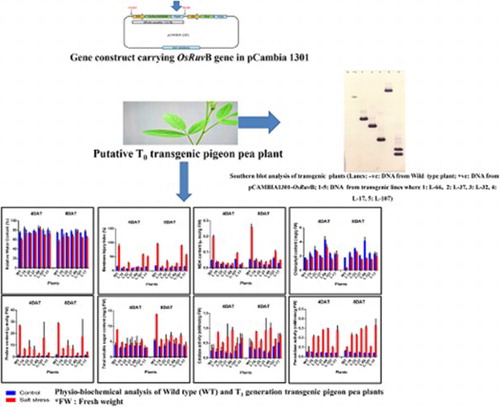
Figure 1. 1.5% Agarose gel showing PCR amplification of OsRuvB gene using gene specific primers (Lanes: M: 1 kb DNA ladder (Fermentas); −ve: negative control; 1–70: T0 plant samples; +ve: positive control). Full length gels are displayed in supplementary figure 1. Different gels separated by white spacing in between.
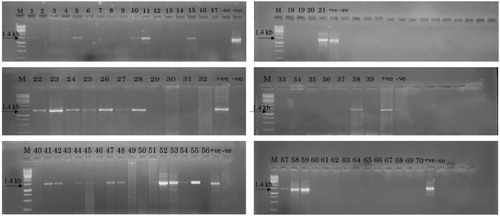
Figure 2. Southern blot analysis of transgenic plants (Lanes: –ve: DNA from Wild type plant; +ve: DNA from pCAMBIA1301-OsRuvB; 1–6: DNA from transgenic lines where 1: L-66, 2: L-37, 3: L-32, 4: L-17, 5: L-107, 6: L-10). Full length blots are displayed in supplementary figure 2. Different blots separated by white spacing in between.
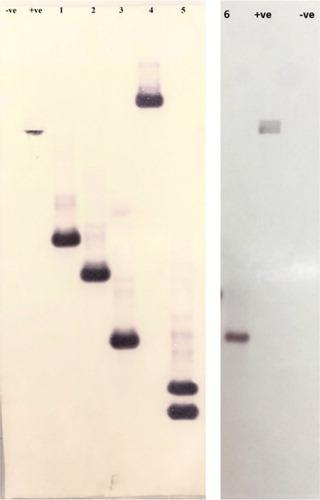
Table 1. Seed yield (g/plant) in T0 transgenic and wild type pigeon pea plants.
Table 2. Segregation analyses of the transgene in T1 progeny of transgenic pigeon pea based on PCR analysis.
Figure 3. Wild type and T1 transgenic pigeon pea plants 8 days after giving 75 mM salt treatment.
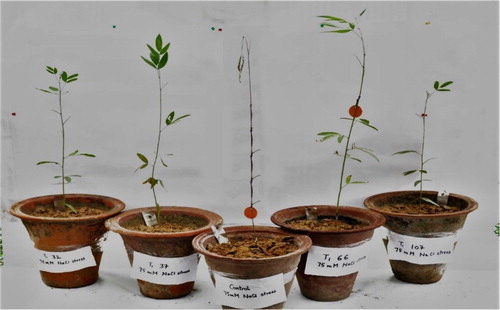
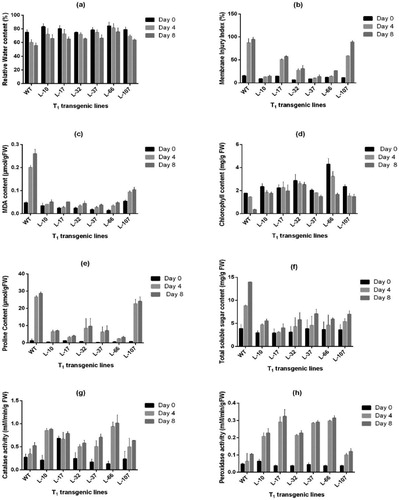
Figure 4. Effect of salt stress (75 mM NaCl) on (a) Relative Water content (%), (b) Membrane Injury Index (%), (c) MDA content (µmol/g FW), (d) Chlorophyll content (mg/g FW), (e) Proline content (µmol/g FW), (f) Total Soluble Sugar content (mg/g FW), (g) Catalase activity (mM/min/g FW), (h) Peroxidase activity (mM/min/g FW) in wild type and T1 transgenic pigeon pea lines. (Detailed analysis given in supplementary table 1–8).