Figures & data
Figure 1. Schematic diagram of the experimental design for systemic-induced resistance for plant. (a) Experiment1 (1) an unclipped branch and five assay branches, (2) a clipped branch and five assay branches. (b)Experiment2 (1) an unclipped control branch and five assay branches, (2) a clipped branch enclosed in a plastic bag and five assay branches, (3) clipped branch and assay branch.
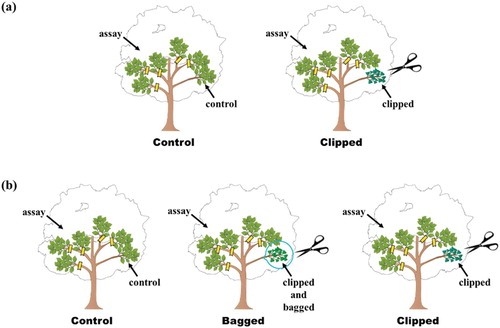
Figure 2. Systemic induced resistance. The number of damaged leaf segments for assay branches.
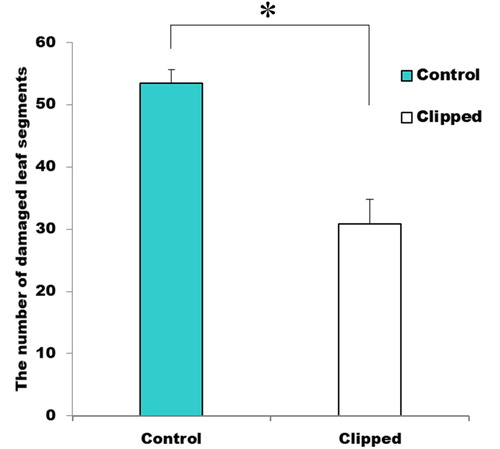
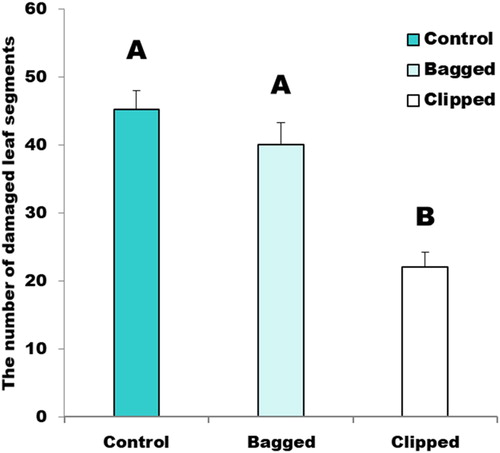
Figure 3. The number of damaged segments for assay branches, Letters above the bars indicate statistical differences among means using Tukey’s hsd.