Figures & data
Figure 1. Structural of NFA (A) and its antioxidant activity in S. cerevisiae (B). The data represented 10 times dilution of yeast cells in three independent experiments. Stress was simulated by 2 mM H2O2, and the control group was treated by water.
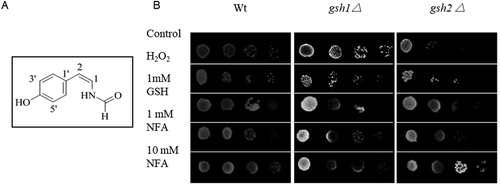
Figure 2. Effects of NFA on Arabidopsis seedlings under flooding. A: Flooded for 4d, B: NFA (1 μg/mL) and flooded, C: NFA (10 μg/mL) and flooded, D: NFA (100 μg/mL) and flooded, E: No flooded, F: NFA (100 μg/mL) no flooded. G–J: Contents of MDA, SOD, ADH and NADPH, ‘**’means significant differences in P < 0.01.
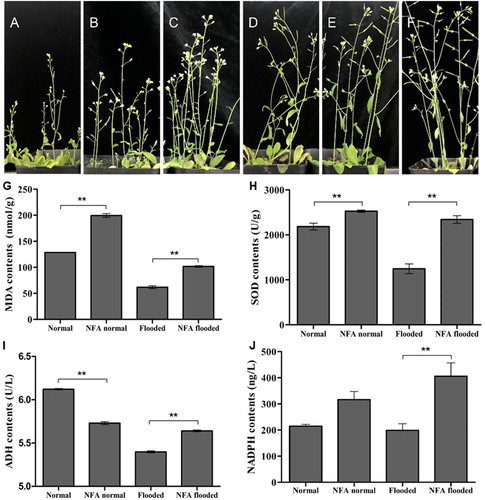
Figure 3. The relative level of Atrboh D and Atrboh F. A and B: The expression with flooding time. C and D: The expression of Atrboh D (C) and Atrboh F (D) after NFA treatment without flooding stress. E and F: The expression comparison of Atrboh D (E) and Atrboh F (F) after NFA treatment under normal or flooding conditions.
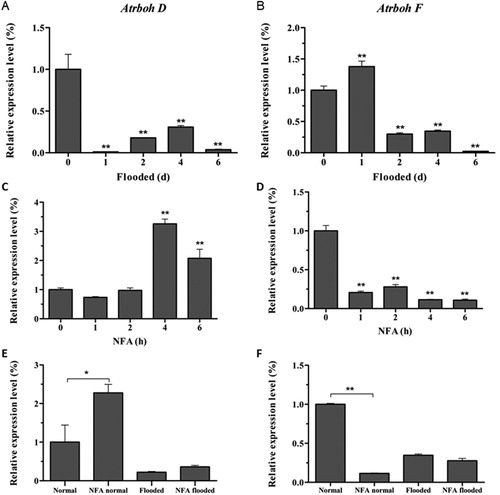
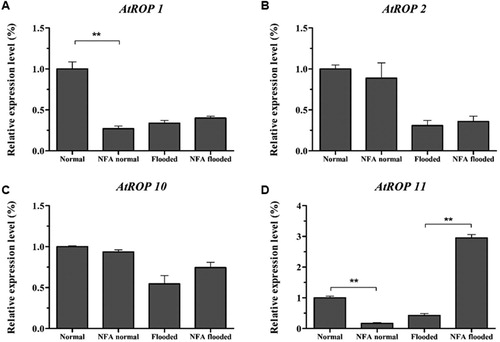
Figure 4. Expression of AtROPs after NFA treatment under normal or flooding conditions, A–D represents respectively AtROP1, AtROP2, AtROP10 and AtROP11.