Figures & data
Table 1. Effect of A. niger filtrate on the growth of rice seedlings.
Figure 1. Phylogenetic tree construction (using 12 taxa, 11 reference and 1 clone) for the molecular identification of isolate SonchL-7 using neighbor joining (NJ) method. 49% bootstrap value confirmed isolate SonchL-7 as A. niger.
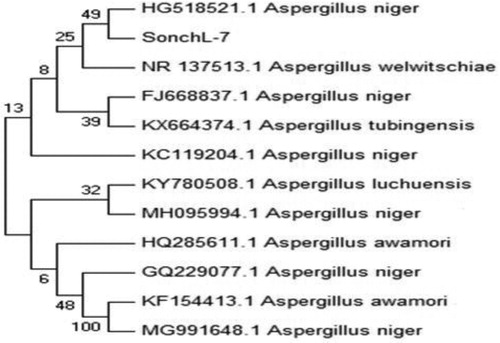
Table 2. Effect of A. niger on the growth of sunflower seedlings.
Table 3. Effect of A. niger on the growth of soybean seedlings.
Figure 2. (A) Hydrogen peroxide (H2O2) and (B) lipid peroxidation (MDA) B in soybean or sunflower seedlings grown at 25°C and 40°C inoculated with and without A. niger. Data represent mean of biological triplicates. Similar bars labeled with different letters are significantly different (p < 0.05) as estimated by Duncan’s Multiple Range Test (DMRT).
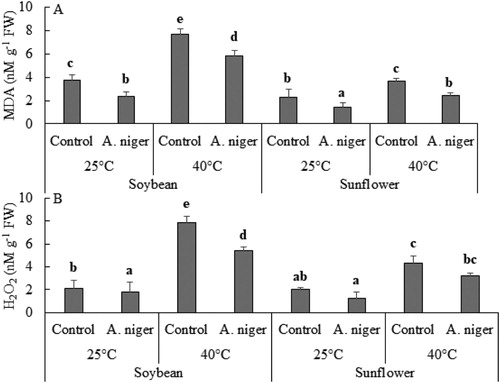
Figure 3. (A) Total proline and (B) phenolics in soybean or sunflower seedlings grown at 25°C and 40°C inoculated with and without A. niger. Data represent mean of biological triplicates. Similar bars labeled with different letters are significantly different (p < 0.05) as estimated by Duncan’s Multiple Range Test (DMRT).
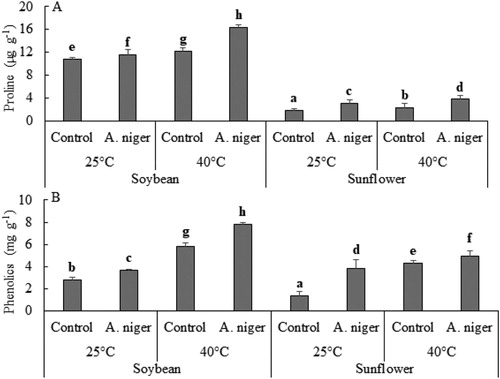
Figure 4. Activity of (A) CAT; (B) POD; (C) AAO; (D) SOD and (E) GSH in soybean or sunflower seedlings grown at 25°C and 40°C inoculated with and without A. niger. Data represent mean of biological triplicates. Similar bars labeled with different letters are significantly different (p < 0.05) as estimated by Duncan’s Multiple Range Test (DMRT).
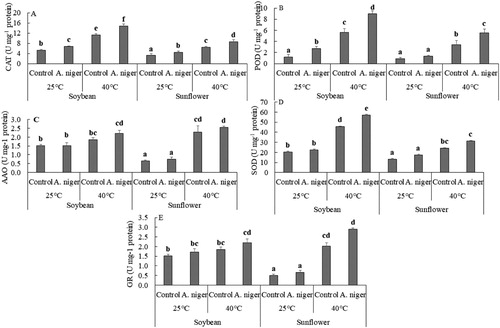
Figure 5. GC MS analysis of ABA content of soybean or sunflower seedlings grown at 25°C and 40°C inoculated with and without A. niger. Data represent mean of biological triplicates. Similar bars labeled with different letters are significantly different (p < 0.05) as estimated by Duncan’s Multiple Range Test (DMRT).
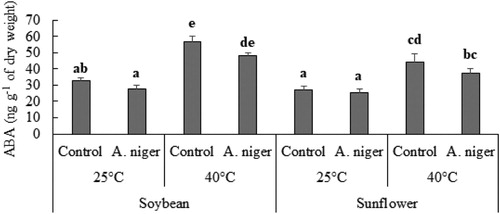
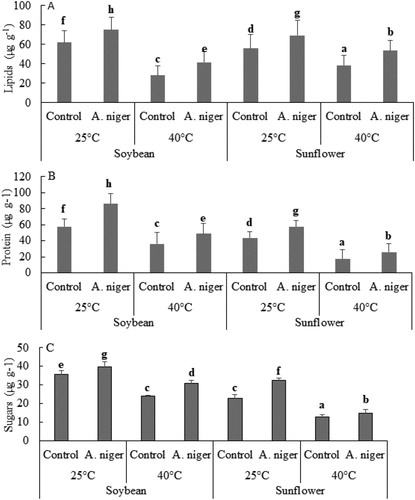
Figure 6. Analysis of total lipids (A), proteins (B) and soluble sugars (C) of soybean or sunflower seedlings grown at 25°C and 40°C inoculated with and without A. niger. Data represent mean of biological triplicates. Similar bars labeled with different letters are significantly different (p < 0.05) as estimated by Duncan’s Multiple Range Test (DMRT).