Figures & data
Figure 1. (A) seeds priming; (B) pot-in-jar system; (C) volatiles trapping system application (D) plants growing in the greenhouse.
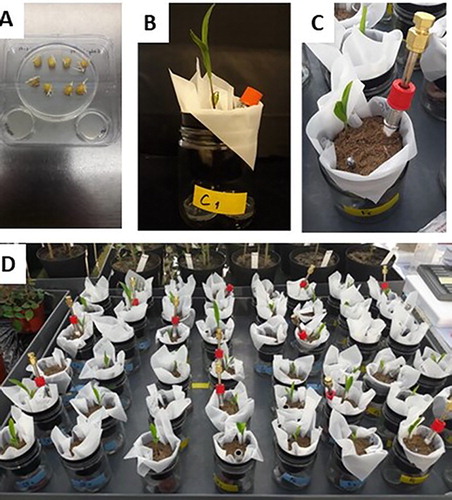
Figure 2. Principal component analysis (PCA) of macronutrients and micronutrients content in both shoot (upper panels) and root (lower panels) tissues of maize plant grown under treatments: C, control; F, F. culmorum in monoculture; S, S. plymuthica in monoculture; SF, both S. plymuthica and F. culmorum in interaction.
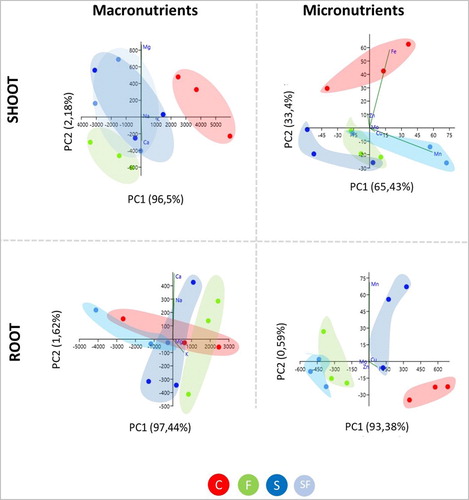
Table 1. Mineral nutrients content (expressed as µg g−1 DW) in shoot and root tissues of maize plants grown in pot-in-jar system under the following treatments: C, control (plant not exposed to volatiles); S, plant exposed to Serratia-emitted volatiles, F, plant exposed to Fusarium-emitted volatiles; SF, plant exposed to both Serratia-emitted and Fusarium – emitted volatiles. Data are shown as the mean (±SE) from three independent biological replicates.
Figure 3. PLS-DA 2D plot of the volatiles collected from the different treatments. C, control; F, F. culmorum in monoculture; S, S. plymuthica in monoculture; SF, both S. plymuthica and F. culmorum in interaction. The explained variance is shown in brackets.
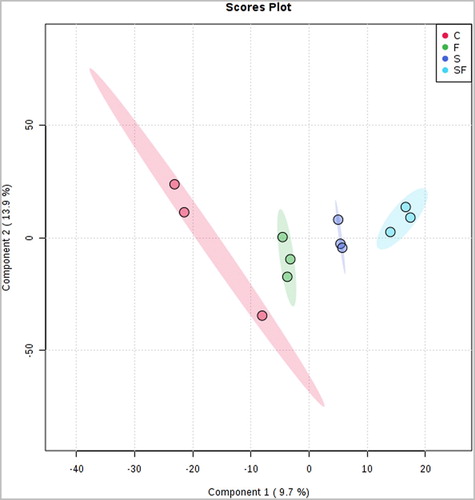
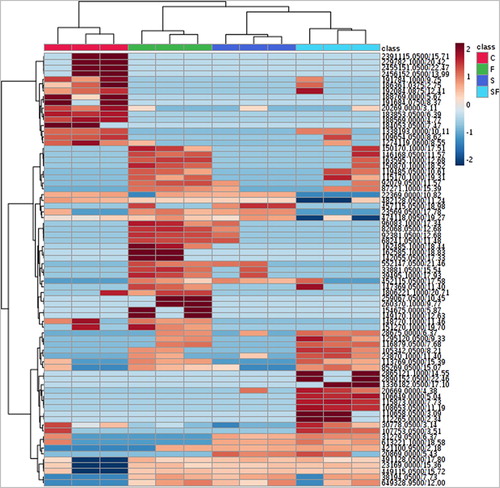
Figure 4. Heatmap showing the hierarchical clustering of the samples based on Euclidean distance. The top 75 mass features for the different treatments ranked by t-tests are shown. Columns represent the samples, in three replicates. Rows represent mass features. Blue, low abundance; Red, high abundance. C, control; F, F. culmorum in monoculture; S, S. plymuthica in monoculture; SF, both S. plymuthica and F. culmorum in interaction.