Figures & data
Figure 1. AIW1 and AIW2 are closely related ABA responsive genes. (a) Expression of AIW1 and AIW2 in response to ABA. Twelve-day-old Col seedlings were mock-treated or treated with 50 µM ABA for 4 h, total RNA was isolated, and cDNA was synthesized and used for RT-PCR. ACT2 was used as a control. (b) Amino acid sequence alignment of AIW1 and AIW2. Identical amino acids were shaded in dark gray, and similar ones in light gray. Underlines indicate the WD40 repeats. (c) Amino acid identity and similarity of AIW1 and AIW2. Full-length amino acid sequences of AIW1 and AIW2 were subjected to SIAS (http://imed.med.ucm.es/Tools/sias.html) for identity and similarity assay.
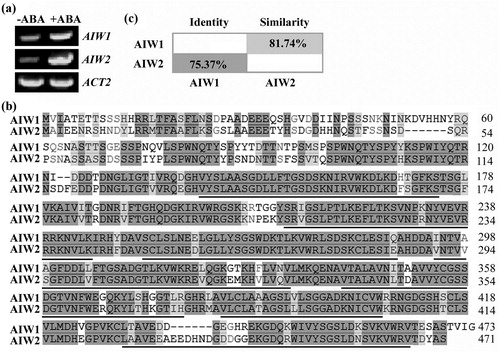
Figure 2. AIW1 and AIW2 are transcription repressors. (a) Subcellular localization of AIW1 and AIW2. Plasmids of the effector genes AIW1-GFP and AIW2-GFPS were transfected into Arabidopsis protoplasts, respectively. Plasmids of NLS-RFP were co-transfected as a nuclear marker. The transfected protoplasts were incubated in dark for 20–22 h at room temperature, then GFP and RFP fluorescence was observed under a confocal microscope. (b) Transcriptional activities of AIW1 and AIW2. Plasmids of the reporter gene LexA-Gal4:GUS and the effector genes GD, LD-VP and GD-AIW1 or GD-AIW2 were co-transfected into protoplasts. The transfected protoplasts were incubated in dark for 20–22 h at room temperature, then GUS activities were measured by using a microplate reader. Data represent the mean ± SD of three replicates. *Significantly different from the control (p < .005).
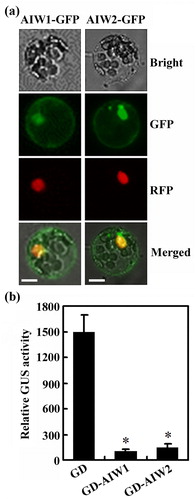
Figure 3. Generation of the aiw1 and aiw2 single, and the aiw1 aiw2 double mutants. (a) T-DNA insertion position of the aiw2-1 single mutant, and the edited sites in the gene edited mutants. Seeds of the T-DNA line SALK_202135C was obtained from ABRC, and the aiw2-1 mutant was identified by genotyping. Gene edited mutants were obtained by CRISPR/Cas9 gene editing. (b) Alignment of the targeted nucleotide sequences of AIW1 and AIW2 by CRISPR/Cas9 in the Col wild type, the aiw1 and aiw2 single and the aiw1 aiw2 double mutants. The mutants were obtained by transforming Col wild type plants with AIW1 or AIW2 targeting pHEE constructs, examining the editing status in T1 generation, and isolating Cas9-free homozygous mutants in T2 generation. Numbers beside and above the sequences indicate the position of the nucleotides relative to the start codon. Underlines indicate the PAM sites. (c) Alignment of AIW1 and AIW2 amino acid sequences in the Col wild type, the aiw1 and aiw2 single and the aiw1 aiw2 double mutants. AIW1 and AIW2 sequences in the mutants were subjected to ORF analysis by using ORFfinder (https://www.ncbi.nlm.nih.gov/orffinder/), and predicted amino acid sequences were used for alignment with AIW1 and AIW2 amino acid sequences, respectively. Numbers beside the sequences indicate the position of the amino acid relative to the Met encoded by the start codon.
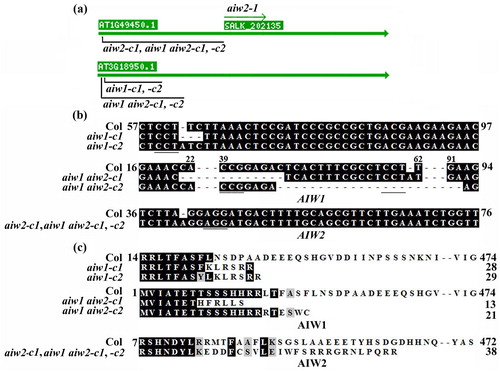
Figure 4. Root elongation of the 35S:AIW1 transgenic plants, the aiw1 and aiw2 single and the aiw1 aiw2 double mutant seedlings. (a) Expression of AIW1 in Col wild type, the 35S:AIW1 transgenic plants, the aiw1 and aiw2 single and the aiw1 aiw2 double mutants. Total RNA was isolated from 12-day-old seedlings, and qRT-PCR was used to examine the expression of AIW1. ACT2 was used as an inner control, and the expression of AIW1 in the Col wild type was set as 1. Data represent the mean ± SD of three replicates. *Significantly different from that in the Col wild type (p < .0001). (b) Primary root length of 8-day-old seedlings of the Col wild type, the 35S:AIW1 transgenic plants, the aiw1 and aiw2 single and the aiw1 aiw2 double mutants. Sterilized seeds were plated on 1/2 MS plates, the plates were kept at 4°C and in darkness for 2 days before transferred to and grown vertically in a growth room. Root length of the seedlings was measure 8 days after the transfer, and average root length was calculated. Data represent the mean ± SD of 25–31 seedlings. *Significantly different from the Col wild type (p < .0001).
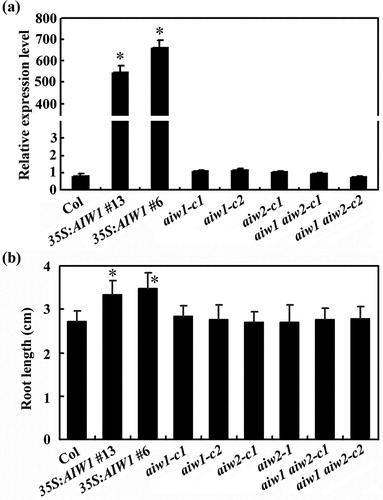
Figure 5. Effects of ABA on seed germination of the Col wild type, the 35S:AIW1 transgenic plants, the aiw1 and aiw2 single and the aiw1 aiw2 double mutants. Sterilized seeds of the Col wild type, the 35S:AIW1 transgenic plants, the aiw1 and aiw2 single, and the aiw1 aiw2 double mutants were plated on 1/2 MS plates with or without 1 µM ABA. The plates were kept at 4°C and in darkness for 2 days before transferred to a growth room. The number of seeds germinated was counted at indicated time points, and percentage of germination was calculated. Data represent the mean ± SD of three replicates.
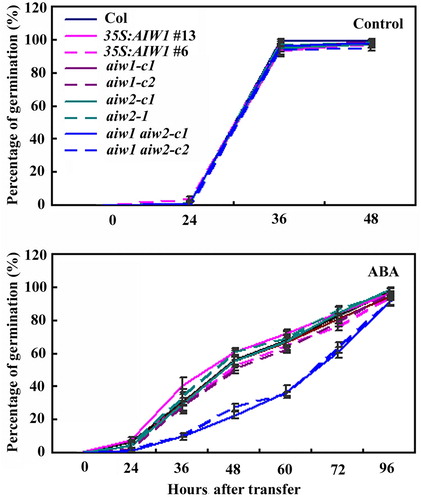
Figure 6. Effects of ABA on cotyledon greening of the Col wild type, the 35S:AIW1 transgenic plants, the aiw1 and aiw2 single and the aiw1 aiw2 double mutants. (a) Cotyledon greening of the Col wild type, the 35S:AIW1 transgenic plants, the aiw1 and aiw2 single and the aiw1 aiw2 double mutants. Sterilized seeds were plated on 1/2 MS plates with or without 1 µM ABA. The plates were kept at 4°C in darkness for 2 days before transferred to a growth room. Pictures were taken 14 days after the transfer. (b) Quantitative of green seedlings of the Col wild type, the 35S:AIW1 transgenic plants, the aiw1 and aiw2 single and the aiw1 aiw2 double mutants in response to ABA treatment. Seedlings with green cotyledons were counted 14 days after the transfer, and percentage of green cotyledons was calculated. Data represent the mean ± SD of three replicates. *Significantly different from the Col wild type (p < .001).
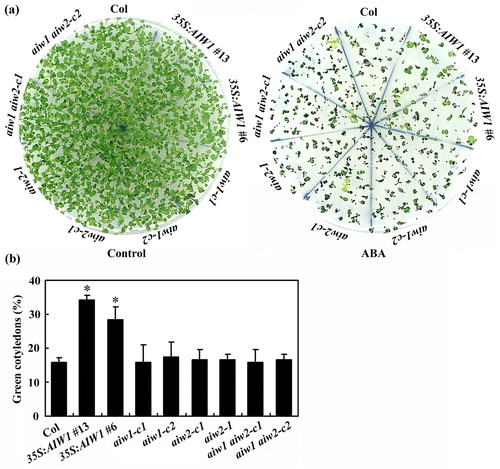
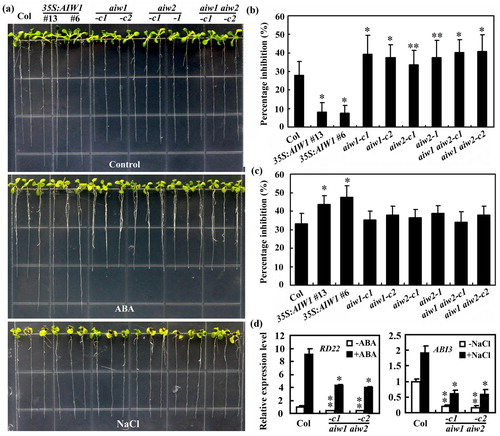
Figure 7. Effects of ABA and NaCl on root elongation of the Col wild type, the 35S:AIW1 transgenic plants, the aiw1 and aiw2 single and the aiw1 aiw2 double mutants. (a) Ten-day-old seedlings of the Col wild type, the 35S:AIW1 transgenic plants, the aiw1 and aiw2 single and the aiw1 aiw2 double mutants. Sterilized seeds were plated on 1/2 MS plates. The plates were kept at 4°C and in darkness for 2 days, transferred to a growth room and grown vertically for 4 days. The seedlings were then transferred to control plates and plates containing 5 μM ABA or 150 mM NaCl, and grown for 6 more days. (b) Quantitative of root elongation inhibition by ABA. Length of new elongated roots was measured, and percentage of inhibition was calculated. Data represent means ± SD of 20–29 seedlings. Significantly different from the Col wild type (*p < .0001, **p < .05). (c) Quantitative of root elongation inhibition by NaCl. Data represent means ± SD of 16–26 seedlings. *Significantly different from the Col wild type (p < .0001). (d) Expression of RD22 in response to ABA and ABI3 in response to NaCl in the Col wild type and the aiw1 aiw2 double mutants. Seedlings were treated with 50 µM ABA or 150 mM NaCl for 4 h, total RNA was isolated and qRT-PCR was used to examine the expression of RD22 and ABI3, respectively. ACT2 was used as an inner control, and the expression of corresponding gene in the Col wild type control seedlings was set as 1. Data represent the mean ± SD of three replicates. Significantly different from that in the Col wild type (*p < .05, **p < .005).